

COMMUNITY SAVINGS BANK
101 E. Union St.
Edgewood, Iowa 52042
ASSESSMENT AREA
Clayton County: All Census Tracts
Delaware County: All Census Tracts
Linn County: All Census Tracts
Dubuque County: Census Tracts 0102.01, 0102.02, 0104.00, and 0105.00
(March 2023 kjb)
OFFICE CLOSINGS AND OPENINGS DURING THE PAST TWO YEARS
Garnavillo Branch Relocated from 101 South Main Street Garnavillo Iowa 52049 to 103 West Clayton Street Garnavillo Iowa 52049
(April 2024 kjb)
LOAN TO DEPOSIT RATIO
March 31, 2023 – 92%
June 30, 2023 – 88%
September 30, 2023 – 84%
December 31, 2023 – 88%
(April 2024 kjb)
HOME MORTGAGE DISCLOSURE ACT NOTICE
The HMDA data about our residential mortgage lending are available online for review. The data shows geographic distribution of loans and applications; ethnicity, race, sex, age, and income of applicants and borrowers; and information about loan approvals and denials. HMDA data for many other financial institutions are also available online. For more information, visit the Consumer Financial Protection Bureau’s Website (www.consumerfinance.gov/hmda).
(March 2023 kjb)
COMMUNITY SAVINGS BANK BRANCHES
Cedar Rapids* Monday thru Friday
3414 Mount Vernon Road SE 9:00 AM – 5:00 PM
Cedar Rapids, Iowa 52403
Phone: 319-363-0577
Fax: 319-363-0578
MSA 16300, Census Tract .00016
Coggon* Monday thru Thursday/Lobby Friday/Lobby
203 East Main Street 9:00 AM – 4:00 PM 9:00 AM – 5:00PM
PO Box 139
Coggon, Iowa 52218 Monday thru Thursday/Drive-Up Friday/Drive-Up
Phone: 319-435-2551
Fax: 319-435-2555 8:30 AM – 4:00PM 8:30 AM – 5:00 PM
MSA 16300, Census Tract 0101.00
Dyersville* Monday thru Thursday Friday
1211 12th Avenue SE 8:30 AM – 4:00 PM 8:30 AM – 5:00PM
Suite 103
Dyersville, Iowa 52040
Phone: 563-875-6296
Fax: 563-875-6272
MSA 20220, Census Tract 0105.00
Earlville* Monday thru Thursday Friday Saturday (Drive-Thru Only)
106 Northern Avenue 9:00 AM – 3:00 PM 9:00 AM – 4:00 PM 8:30 AM – 11:00 AM
Earlville, Iowa 52041
Phone: 563-923-3145
Fax: 563-923-4945
MSA NA (outside of MSA), Census Tract 9501.00
Edgewood* Monday thru Friday Saturday (Drive-Thru Only)
101 East Union Street 9:00 AM – 3:00 PM 8:30 AM – 11:00 AM
Edgewood, Iowa 52042
Phone: 563-928-6425
Fax: 563-928-6240
MSA NA (outside of MSA), Census Tract 9502.00
Garnavillo* Monday thru Thursday Friday
103 West Clayton Street 8:30 AM – 4:00 PM 8:30 AM – 5:00PM
Garnavillo, Iowa 52049
Phone: 800-828-2318
Fax: 563-964-2485
MSA NA (outside of MSA), Census Tract 0701.00
Guttenberg* Monday thru Friday
502 South Highway 52 8:30 AM – 4:00 PM
Guttenberg, Iowa 52052
Phone: 563-252-1048
MSA NA (outside of MSA), Census Tract 0704.00
Manchester* Monday thru Thursday Friday Saturday (Drive-Thru Only)
221 East Main Street 9:00 AM – 4:00 PM 9:00 AM – 5:00 PM 8:30 AM – 11:00 AM
Manchester, Iowa 52057
Phone: 563-927-4014
Fax: 563-927-2411
MSA NA (outside of MSA), Census Tract 9503.00
Marion* Monday thru Friday Saturday
1295 Blairs Ferry Road 9:00 AM – 5:00 PM Not Open
Marion, Iowa 52302
Phone: 319-447-2551
Fax: 319-447-2556
MSA 16300, Census Tract 0003.00
Robins* Monday thru Friday Saturday (Drive-Thru Only)
101 Robins Square Court 9:00 AM – 5:00 PM 8:30 AM – 11:00 AM
Robins, Iowa 52328
Phone: 319-294-2783
Fax: 319-294-2784
MSA 16300, Census Tract 0002.06
*24 Hour ATM Available
COMMUNITY SAVINGS BANK SERVICE CHARGE MENU
Account activity printout (current month) * $1.87
Account balancing assistance ($10.00 min.) per hour * $18.69
Account Closed within 90 days * $14.01
(Charge not applicable to the following checking account types:
Simply Free Checking, Classic 50 Checking, VIP Direct Checking,
Ultimate Interest Checking, Simply Free Business Checking,
Business Interest Checking and Commercial Checking.)
Account Research ($10.00 min.)/per hour $18.69
Bank Sweep Manager $28.00
Cashier’s Check – (non CSB Bankclub Member) $5.00
Check Cashing non-customer ($5.00 min.) 3% of amount
Coin Counting non-customers ($5.00 min.) 5% of amount
Copy of extra statement * (per month) $2.80
Counter Checks $1.00 per 5 checks
CSB Debit Card- Annual Fee * (2 card limit) $12.00
CSB Debit Card Replacement * (per card) $18.69
CSB Debit Card Chargeback Research * (per hour) $18.69
CSB Debit Card Hotcard * (includes re-issuance fee) $18.69
Deposit Book (duplicate pad) $9.35
Fax (per page) $2.00
Foreign/Canadian deposited items * $23.37
Garnishments/Levies $50.00
Gift Card $4.95
Inactive Account Fee $10.00
Medallion Signature $10.00 (CSB Customer)
$50.00 (non-CSB Customer)
Mortgage amortization schedule $10.00
Night Deposit Key Deposit/Lost $25.00
Night Deposit Bag (Locking) $25.00
Night Deposit Bag (Zipper) $5.00
Notary (Non-customer) $2.00
Outgoing ACH Recurring (per item) $5.00
Overdraft – per item (Consumer limit of 5 per day) *** $30.00
Paper Statements (per month) $2.80
Personal Money Order (under $5000.00)– (non CSB Bankclub Member) $3.00
Photocopy (Black/White) $.25
Photocopy (Color) $.50
Pre-Authorized Automatic Transfer to avoid Overdraft Charge* $4.67
Return Item (NSF) (per presentment) $30.00
Safe Deposit (Replacement key) $15.00
Select Line of Credit- Annual Fee $40.00
Special Statement cut-off* $4.67
Special Statement handling (waived if E-statement) * $4.67
Stop Payment* $28.04
Travel Card Purchase Card $9.95
Travel Card Reload Card $4.95
Wire Transfer Incoming $10.00
Wire Transfer Domestic outgoing $25.00
Wire Transfer International Outgoing $50.00
Undeliverable Mail Fee $3.00
Personalized Checks, cost will vary.
*Applicable service charges are subject to Iowa State tax, Local Option tax, and Iowa School Local Option Tax
***Overdrafts can be created by check, in-person withdrawal, ATM withdrawal, or other electronic means.
(March 2024 kjb)
COMMUNITY SAVINGS BANK MORTGAGE LOAN PROGRAMS
The following mortgage loan programs are offered by Community Savings Bank:
- Conventional Uninsured (Less than 80% LTV Loans)
- Conventional Insured (Loans with LTV’s of greater than 80% insured by Private Mortgage Insurance)
- In-house Mortgages (For borrowers that may not meet secondary market investor guidelines at the current time)
- IFA FirstHome & IFA FirstHome Plus and Homes for Iowans and Homes for Iowans Plus (Offered through Iowa Finance Authority IFA) Offers low or no down payment fixed rate programs to qualified borrowers.
- IFA Grants are available in conjunction with IFA FirstHome Plus and IFA Homes for Iowans Plus programs for qualified borrowers. We work with IBMC (Iowa Bankers Mortgage Corporation) for the grant programs.
- FHLB HomeStart Grant-Funds are available for $7,500 Down Payment Assistance Grants to qualified low-income first-time homeowner households.
- Mortgage Credit Certificates (MCC’s) Allows the borrower to receive a Federal Tax Credit for a percentage of the interest paid on their home loan. This is funded from year to year by the Iowa Legislature.
- MHOA Military Home Ownership Assistance Grants administered by the Iowa Finance Authority.
- USDA Rural Development Guarantee Loans Zero percent down 30-year mortgage with a RD Guarantee instead of PMI
- Agri-Access Rural Living Loan This program is for rural homes that appraisals may not meet the standard secondary market criteria due to number of acres. We work with IBMC for this program.
- HOAP Program (forgivable grant for improvements—offered through cities)
- Community Seconds Program for cities that are offering incentive to build or rehab in certain parts of the city.
- OSWAP (Onsite Wastewater Assistance Program) Low-interest loans for on-site septic system replacement.
We are able to offer most loan programs offered through the following secondary market investors: Conforming, non-conforming loans and government loans.
Fannie Mae, Universal Lending, AgriAccess, Iowa Finance Authority and Iowa Bankers Mortgage Corporation.
Additionally, we are always looking for new investors, and new programs, that will help a wider variety of borrowers with their mortgage financing needs. This would include low-income borrowers, borrowers with better incomes but no/low down payment, borrowers seeking jumbo financing, and everyone in-between.
(March 2023 kjb)
COMMUNITY SAVINGS BANK SERVICES PROVIDED
Checking Accounts Savings Accounts Wealth Management
Individual Retirement Accounts Private Business Account Manager Money Orders
Cashier’s Checks Stop Payment Orders Wire Transfer Service
Overdraft Protection Corporate Sweep Manager Private Education Loans
Gov’t Guaranteed Student Loan Access Direct Deposit ACH Origination
Safe Deposit Box Night Deposit Box SHAZAM Debit Cards
Escrow Service Notary Service Tax Collection Service
Purchase & Sales of Securities Fax Service Mobile Banking
US Savings Bonds through TreasuryDirect.Gov Mobile Deposit
Internet Online Banking & Bill Pay Mobile Website Telephone Money Line Banking
Merchant Remote Capture Direct Business Loans Website Savings Account Applications
Website Consumer Loan Application Gift Cards Website Mortgage Loan Applications
Credit Cards through Elan Direct Consumer Loans Direct Agricultural Loans
Website Business Loan Applications Residential Mortgage Loans HELOC
Merchant Card Processing
**We are an Equal Housing Lender and Member FDIC
(March 2023 kjb)
COMMUNITY SAVINGS BANK DEPOSIT PRODUCTS
Personal Checking
Smart Checking
- Available to customers ages 18 or under
- Quarterly Educational Newsletter
- Secure Parental Oversight
- Teen-owned Debit Card
- Free Community Savings Bank standard checks
- No monthly maintenance fee
- No minimum balance requirements
- Unlimited check writing
- Free online banking & bill pay
- Free mobile banking with mobile deposit
- Person-to-person (P2P) payments available
- Free e-statements
- Free telephone banking
- Free Mastercard® debit card
- Nationwide surcharge-free ATM access via the SHAZAM Privileged Status ATM network
- $50 minimum deposit to open
*Other fees such as overdraft, return (NSF), paper statements, etc. may apply. See fee schedule for details. Offer good on personal accounts only. Ask us about our great business checking plans including Simple Business Checking. Bank rules and regulations apply. Minimum opening deposit is only $50. Ask us for details.
Simple Checking
- Simple checking account
- Free Community Savings Bank standard checks
- No monthly maintenance fee
- No minimum balance requirements
- Unlimited check writing
- Free online banking & bill pay
- Free mobile banking with mobile deposit
- Person-to-person (P2P) payments available
- Free e-statements
- Free telephone banking
- Free Mastercard® debit card
- Nationwide surcharge-free ATM access via the SHAZAM Privileged Status ATM network
- $50 minimum deposit to open
*Other fees such as overdraft, return (NSF), paper statements, etc. may apply. See fee schedule for details. Offer good on personal accounts only. Ask us about our great business checking plans including Simple Business Checking. Bank rules and regulations apply. Minimum opening deposit is only $50. Ask us for details.
VIP Direct Checking
- Competitive interest on entire balance
- Free Community Savings Bank standard checks
- No monthly maintenance fee
- No minimum balance requirements
- Unlimited check writing
- Free online banking & bill pay
- Free mobile banking with mobile deposit
- Free e-statements
- Free telephone banking
- Free CSB Debit Card
- Nationwide surcharge-free ATM access via the SHAZAM Privileged Status ATM network
- $50 minimum deposit to open
*Interest accrues daily based on daily available balance paid monthly.
*Other fees such as overdraft, return (NSF), paper statements, etc. may apply. See fee schedule for details. Offer good on personal accounts only. Ask us about our great business checking plans including Simple Business Checking. Bank rules and regulations apply. Minimum opening deposit is only $50. Ask us for details.
Ultimate Interest Checking
- Higher interest rate with a balance of $1,000 and above
- Free Community Savings Bank standard checks
- Avoid the $6 monthly maintenance fee by maintaining a $1,000 minimum daily balance
- Unlimited check writing
- Free online banking & bill pay
- Free mobile banking with mobile deposit
- Free e-statements
- Free telephone banking
- Free CSB Debit Card
- Nationwide surcharge-free ATM accessvia the SHAZAM Privileged Status ATM network
- $50 minimum deposit to open
*Other fees such as overdraft, return (NSF), paper statements, etc. may apply. See fee schedule for details. Offer good on personal accounts only. Ask us about our great business checking plans including Simple Business Checking. Bank rules and regulations apply. Minimum opening deposit is only $50. Ask us for details.
Personal Savings
Regular Savings Account
- Straightforward savings account
- Avoid the $3.33 monthly maintenance fee by maintaining a $100 minimum daily balance
- 6 free withdrawals per month; $1 fee for withdrawals in excess thereafter
- Free online banking
- Free mobile banking with mobile deposit
- Free e-statements
- Free telephone banking
- $50 minimum deposit to open
Star Plus Money Market Account
- Competitive, tiered interest
- Higher balances earn higher rates
- Interest accrued daily and paid monthly
- Enjoy flexibility with enhanced access to funds, including direct check writing:
- Unlimited in-person withdrawals or by mail
- 6 free transactions per month by pre-authorized automatic, telephone, checks, drafts, or other similar order; $5 per transaction in excess thereafter
- Avoid the $10.00 monthly maintenance fee by maintaining a $2,500 minimum daily balance
- Free online banking & bill pay
- Free mobile banking with mobile deposit
- Person-to-person (P2P) paymentsavailable
- Free e-statements
- Free telephone banking
- Free Mastercard® debit card
- Nationwide surcharge-free ATM accessvia the SHAZAM Privileged Status ATM network
- $2,500 minimum deposit to open
Christmas Club Account
- Set aside little by little, year-round for holiday expenses
- Competitive interest on entire balance
- No monthly maintenance fee
- No minimum balance requirements
- Make deposits at any time, in any amount you feel comfortable with
- Avoid holiday-induced debt and stress
- Funds automatically deposited to a Community Savings Bank account in November*
- Early withdrawal will result in a penalty*
- Free online banking
- Free mobile banking with mobile deposit
- Free e-statements
- Free telephone banking
- $1 minimum deposit to open
*All interest earned will be credited annually. You will forfeit all accrued interest if the account is closed prior to it being credited to your account. Minimum deposit to open the account is $1.00.
Vacation Club Account
- Set aside little by little, year-round for vacation expenses
- Competitive interest on entire balance
- No monthly maintenance fee
- No minimum balance requirements
- Make deposits at any time, in any amount you feel comfortable with
- Rest easy right from the start; avoid unnecessary debt
- Funds automatically deposited to a Community Savings Bank account in May*
- Early withdrawal will result in a penalty*
- Free online banking
- Free mobile banking with mobile deposit
- Free e-statements
- Free telephone banking
- $1 minimum deposit to open
*All interest earned will be credited annually. You will forfeit all accrued interest if the account is closed prior to it being credited to your account. Minimum deposit to open the account is $1.00.
Youth Savings Account
- Available to young savers up to 12 years old
- Competitive interest on entire balance
- No monthly maintenance fee
- No minimum balance requirements
- Establishes the importance and know-how of saving money from an early age
- 6 free transactions per month by pre-authorized automatic, telephone, checks, drafts, or other similar order; $1 per transaction in excess thereafter
- Free online banking
- Free mobile banking with mobile deposit
- Free e-statements
- Free telephone banking
- $50 minimum deposit to open
Health Savings Account (HSA)
- Greater personal control over healthcare management and expenses
- Prepare for qualified medical expenses
- Earn interest above standard savings on entire balance
- Receive higher rates on larger deposits
- An HSA provides triple tax savings:
- Tax deductions when you contribute to your account
- Tax-free earnings through investment
- Tax-free withdrawals for qualified medical, dental, vision expenses, and more*
- Contributions are tax-free and can be made by you, your employer, or a third party
- Funds can be withdrawn at any time**
- No monthly maintenance fee
- No minimum balance requirements
- Unused funds remain in account year after year; no "use it or lose it" policy
- Keep your HSA in your name, regardless of career or life changes
- Federally insured by FDIC
- $50 minimum deposit to open
Eligibility
Most adults under 65 who are not enrolled in Medicare and are covered under a high-deductible health plan (HDHP) can qualify for an HSA, but it is up to the account holders to determine their own eligibility. Please contact your tax advisor for further eligibility requirements.
*Consult a tax advisor.
**You can withdraw funds at any time for any purpose. However, if funds are withdrawn for reasons other than qualified medical expenses, the amount withdrawn will be included as taxable income, and is subject to a 10% penalty.
First-Time Homebuyer Savings Accounts
The State of Iowa has established an Iowa First-Time Homebuyer Savings Account program, which may offer tax advantages on savings for qualified home purchases in Iowa. Accounts may be established by qualifying first-time homebuyers or by others on behalf of qualifying first-time homebuyers. It is important to understand the requirements of the program and you may want to consult your tax advisor.
Learn More About First-Time Homebuyers Savings Account
Home Buyer Savings Includes:
- No minimum to open.
- Earn variable interest rates.
- May claim a deduction for Iowa individual income.
You can learn more about this program by visiting https://tax.iowa.gov/ and searching First-Time Homebuyer Savings Account.
Certificates of Deposit (CDs)
- Fixed rates, higher than regular savings
- Receive higher rates by selecting a longer term
- Provides more guarantee than other risky investments
- Set aside for future savings goals
- A wide range of terms available (from 90 days to 5 years)
- No setup or maintenance fees
- Early withdrawals subject to penalty*
- $1,000 minimum deposit to open
*Early withdrawals may result in penalties. Penalties vary depending on the CD.
Individual Retirement Accounts (IRAs)
- Competitive interest above standard savings rates
- Traditional and Roth IRA options
- No setup fees
- No monthly or annual maintenance fees
- $5,500 contribution limit per year
- Additional $1,000 "catch-up" contribution allowed for ages 50+
- Funds can be used to purchase CDs within IRA
- No minimum deposit to open
Traditional & Roth IRAs
Traditional IRA
- No income limits to open
- No minimum contribution requirement
- Contributions are tax deductible on state and federal income tax*
- Earnings are tax deferred until withdrawal (when usually in lower tax bracket)
- Withdrawals can begin at age 59½
- Early withdrawals subject to penalty**
- Mandatory withdrawals at age 70½
Roth IRA
- Income limits to be eligible to open Roth IRA***
- Contributions are NOT tax deductible
- Earnings are 100% tax free at withdrawal*
- Principal contributions can be withdrawn without penalty*
- Withdrawals on interest can begin at age 59½
- Early withdrawals on interest subject to penalty**
- No mandatory distribution age
- No age limit on making contributions as long as you have earned income
*Subject to some minimal conditions. Consult a tax advisor.
**Certain exceptions apply, such as healthcare, purchasing first home, etc.
***Consult a tax advisor.
COVERDELL ESA
College isn’t getting any cheaper. That makes saving for your child’s education so important. Our Coverdell Education Savings Account (ESA) provides a safe, tax-free place to set funds aside — and earn competitive interest.
- Set aside funds for your child's education
- No setup or annual fee
- Dividends grow tax-free
- Withdrawals are tax-free and penalty-free when used for qualified education expenses*
- Designated beneficiary must be under 18 when contributions are made
- To contribute to an ESA, certain income limits apply**
- Contributions are not tax deductible
- $2,000 maximum annual contribution per child
- The money must be withdrawn by the time he or she turns 30***
- The ESA may be transferred without penalty to another member of the family
- $250 minimum deposit to open
*Qualified expenses include tuition and fees, books, supplies, board, etc.
**Consult your tax advisor to determine your contribution limit.
***Those earnings are subject to income tax and a 10% penalty.
Business Checking Accounts
Simple Business Checking
- Simplified checking solution
- No monthly maintenance fee
- No minimum balance requirements
- Free online banking & bill pay
- Free mobile banking with mobile deposit
- Free e-statements
- Free telephone banking
- Free Mastercard® debit card
- Business servicesavailable
- $50 minimum deposit to open
*Other fees such as overdraft, return (NSF), paper statements, etc. may apply. See fee schedule for details. Offer good on personal accounts only. Ask us about our great business checking plans including Simple Business Checking. Bank rules and regulations apply. Minimum opening deposit is only $50. Ask us for details.
Business Interest Checking
- Available to non-profit organizations and sole proprietorships
- Competitive tiered interest on entire balance
- Avoid the $6 monthly maintenance fee by maintaining a $1,000 minimum daily balance
- Free online banking & bill pay
- Free mobile banking with mobile deposit
- Free e-statements
- Free telephone banking
- Free Mastercard® debit card
- Business servicesavailable
- $50 minimum deposit to open
*Other fees such as overdraft, return (NSF), paper statements, etc. may apply. See fee schedule for details. Offer good on personal accounts only. Ask us about our great business checking plans including Simple Business Checking. Bank rules and regulations apply. Minimum opening deposit is only $50. Ask us for details.
Commercial Checking
- Ideal for businesses with large transaction volumes
- Unlimited monthly transactions available at low per-item fees
- $10 monthly maintenance fee
- Receive an earnings credit to offset or minimize monthly fees incurred***
- Free online banking & bill pay
- Free mobile banking with mobile deposit
- Free e-statements
- Free telephone banking
- Free Mastercard® debit card
- Business services available
- $50 minimum deposit to open
***Earnings credit based on balance requirements.
*Other fees such as overdraft, return (NSF), paper statements, etc. may apply. See fee schedule for details. Offer good on personal accounts only. Ask us about our great business checking plans including Simple Business Checking. Bank rules and regulations apply. Minimum opening deposit is only $50. Ask us for details.
Business Savings Accounts
Regular Business Savings Account
- Convenient savings solution
- Competitive interest on balances of $100 or more
- Avoid the $3.33 monthly service fee by maintaining a $100 minimum daily balance
- 6 free withdrawals per month; $1 fee for withdrawals in excess thereafter
- Free online banking & bill pay
- Free mobile banking with mobile deposit
- Free e-statements
- Free telephone banking
- $100 minimum deposit to open
Business Star Plus Money Market Account
- Competitive, tiered interest
- Higher balances earn higher rates
- Interest accrued daily and paid monthly
- Enjoy flexibility with enhanced access to funds, including direct check writing:
- Unlimited in-person withdrawals or by mail
- 6 free transactions per month by pre-authorized automatic, telephone, checks, drafts, debit cards, or other
- similar order; $5 per transaction in excess thereafter
- Avoid the $10.00 monthly service fee by maintaining a $2,500 minimum daily balance
- Free online banking & bill pay
- Free mobile banking with mobile deposit
- Free e-statements
- Free telephone banking
- Free Mastercard® debit card
- $2,500 minimum deposit to open
Business Retirement Accounts
Simplified Employee Pension (SEP IRA)
- Ideal for businesses of any size or self-employed individuals
- Gain the respect of your employees
- Help employees reach their retirement savings goals
- Employee always has complete ownership of all SEP IRA money
- Earn competitive interest on entire balance
- Contributions are tax deductible; your business pays no taxes on earnings
- Contributions made only by the employer
- Only self-employed may make contributions on their own behalf
- Little to no documents to file with government
- Inexpensive to set up and operate
- Flexible annual contributions – good plan if cash flow is unpredictable
- Can contribute up to 25% of each participant's annual compensation (earned income)
- Or, up to the maximum allowable limit for current plan year, whichever is less
- Must contribute equally for all employees
- Employee must first establish a traditional IRA, in which the employer will deposit SEP contributions
- No minimum deposit to open
Savings Incentive Match Plan for Employees (SIMPLE IRA)
- Available to any small business – generally with 100 or fewer employees
- Gain the respect of your employees
- Employees have the option to make self-contributions
- Help employees reach their retirement savings goals
- Employee always has complete ownership of all SIMPLE IRA money
- Earns a competitive interest rate
- Employer must not have any other retirement plan
- Minimal paperwork necessary; no filing requirements
- Inexpensive to set up and operate
- Lower contribution limits than some other retirement options
- Employees share responsibility of growing their retirement
- Each year, employer is required to contribute:
- Matching contribution up to 3% of compensation, or
- 2% non-elective contribution for each eligible employee
- No minimum deposit to open
COMMUNITY SAVINGS BANK LOAN PRODUCTS
Personal Loans
Student Loans
We work with ISL Education Lending to offer private loans to help you pay for college as well as refinance existing student loans. ISL Education Lending is a nonprofit organization with decades of student loan experience offering lower-priced loans.*
ISL Education Lending offers:
- Loans for college students.
- A loan option for parents and family members who wish to borrow on behalf of a college student.
- Multiple student loan refinance options.
In addition, they offer multiple scholarship opportunities and free college planning tools to help students and families avoid overborrowing and plan smart for life during and after college.
Home Mortgage Loans
- Competitive rates for home purchase, refinance, or construction
- Several financing programs available
- Loan advisors with working knowledge of the local real estate market
Home Equity Loans
- Competitive rates for short-term or ongoing needs
- The existing equity in your home is used as collateral
- Term loan and line of credit options available
Parent Refinance Loan
Student Loan Consolidation
- Competitive rates to consolidate and refinance one or multiple loans
- One easy payment to manage
- Private and Federal loans are eligible for consolidation
Auto Loans
- Competitive rates on new or used vehicles*
- A wide range of terms customized to your unique situation
- Pre-approval available for extra bargaining power
Personal Term Loans
- Competitive rates for a wide variety of personal needs
- Repayment terms customized to fit your unique needs
- Local decision-making and processing
Business Loans
Small Business Administration (SBA) Loans
- Government-assisted financing for qualifying businesses
- A wide range of lending options available
- Generally lower down payments and extended terms
Business Term Loans
- Competitive rates for a wide range of business expenses
- Repayment terms customized to your business needs
- Local decision-making and processing
Business Lines of Credit
- Competitive rates for long-term or seasonal business needs
- Funds available right as you need them
- Only pay interest on the part that's used
Accounts Receivables Financing
- Unlocks working capital and enhances cash flow
- Provides quick access to cash when you need it
- More flexibility than traditional financing
Commercial Real Estate Loans
- Competitive rates to build, buy or refinance commercial properties
- Available for owner-occupied or investment properties
- Loan advisors with working knowledge of the local real estate market
Agricultural Loans
Equipment Loans
- Competitive rates for new or used equipment
- Meet needs without cutting into working capital or savings
- Avoid lapsed periods in production and outdated equipment
Agriculture Real Estate Loans
- Competitive rates to buy or refinance agriculture properties
- Repayment terms customized to fit your operation's needs
- Loan advisors with working knowledge of the local real estate market
Operating Lines of Credit
- Competitive rates for long-term or seasonal agriculture needs
- Funds available right as you need them
- Only pay interest on the part that's used
(March 2023 kjb)
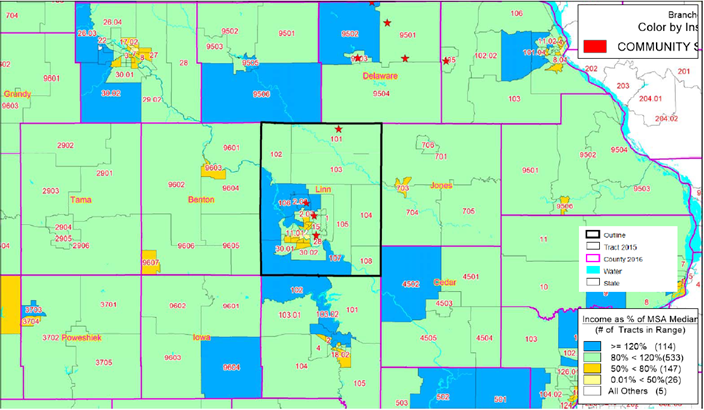
COMMUNITY SAVINGS BANK ASSESSMENT AREA MAP 2021
Community Savings Bank Cert 14633
Edgewood, Iowa
ACS - Cedar Rapids Metro AA - Incomes
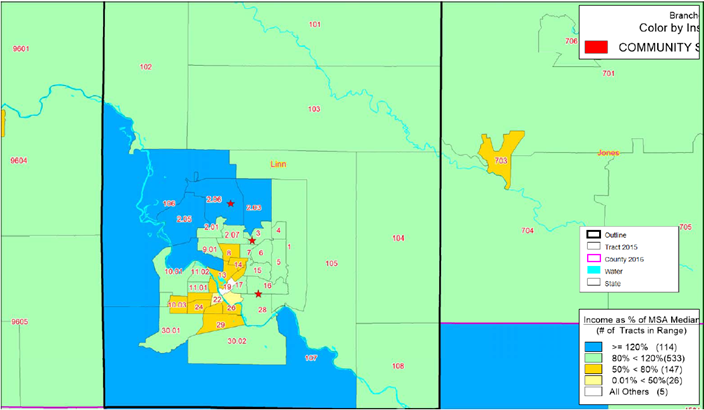
Community Savings Bank Cert 14633
Edgewood, Iowa
ACS - Cedar Rapids Metro AA - Income CLOSER
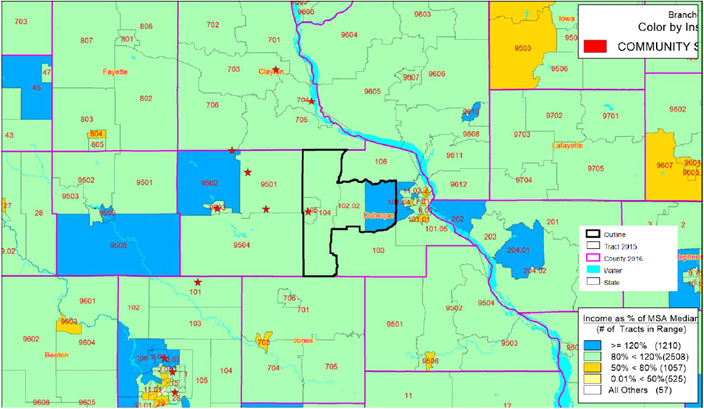
Community Savings Bank Cert 14633
Edgewood, Iowa
ACS - Dubuque Metro AA - Income
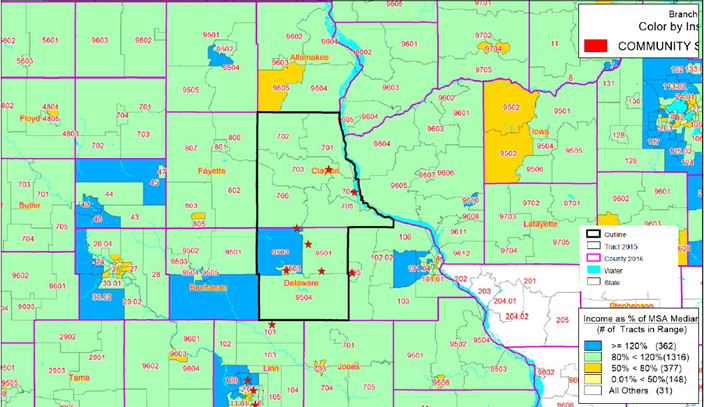
Community Savings Bank Cert 14633
Edgewood, Iowa
ACS - Non-Metro AA - Income
PUBLIC DISCLOSURE
May 24, 2021
COMMUNITY REINVESTMENT ACT PERFORMANCE EVALUATION
Community Savings Bank Certificate Number: 14633
101 East Union Street Edgewood, Iowa 52042
Federal Deposit Insurance Corporation Division of Depositor and Consumer Protection Kansas City Regional Office
1100 Walnut Street, Suite 2100 Kansas City, Missouri 64106
This document is an evaluation of this institution’s record of meeting the credit needs of its entire community, including low- and moderate-income neighborhoods, consistent with safe and sound operation of the institution. This evaluation is not, nor should it be construed as, an assessment of the financial condition of this institution. The rating assigned to this institution does not represent an analysis, conclusion, or opinion of the federal financial supervisory agency concerning the safety and soundness of this financial institution.
TABLE OF CONTENTS
INSTITUTION RATING........................................................................................................ 1
DESCRIPTION OF INSTITUTION........................................................................................................ 2
DESCRIPTION OF ASSESSMENT AREAS........................................................................................................ 3
SCOPE OF EVALUATION........................................................................................................ 3
CONCLUSIONS ON PERFORMANCE CRITERIA....................................................................................................... 5
DISCRIMINATORY OR OTHER ILLEGAL CREDIT PRACTICES REVIEW..................................................................................................... 11
NON-METRO ASSESSMENT AREA – Full-Scope Review...................................................................................................... 12
CEDAR RAPIDS METRO ASSESSMENT AREA – Full-Scope Review..................................................................................................... 17
DUBUQUE METRO ASSESSMENT AREA – Full-Scope Review..................................................................................................... 24
APPENDICES...................................................................................................... 29
INTERMEDIATE SMALL BANK PERFORMANCE CRITERIA.................................................................................................. 29
GLOSSARY.................................................................................................. 30
INSTITUTION RATING
INSTITUTION’S CRA RATING: This institution is rated Satisfactory.
An institution in this group has a satisfactory record of helping to meet the credit needs of its assessment area, including low- and moderate-income neighborhoods, in a manner consistent with its resources and capabilities.
Community Savings Bank (CSB)’s satisfactory Community Reinvestment Act (CRA) performance under the Lending Test and Community Development Test supports the rating. The following points summarize the bank’s Lending Test and Community Development Test performance.
The Lending Test is rated Satisfactory.
- The loan-to-deposit ratio is reasonable given the institution’s size, financial condition, and credit needs of the assessment areas.
- A majority of small farm, small business, and home mortgage loans are inside the bank’s assessment
- The geographic distribution of loans reflects reasonable dispersion throughout the assessment area
- The distribution of borrowers reflects reasonable penetration among farms and businesses of different revenue sizes, as well as individuals of varying income
- The institution did not receive any CRA-related complaints since the previous evaluation; therefore, this factor did not affect the rating.
The Community Development Test is rated Satisfactory.
- Overall, the institution demonstrated adequate responsiveness to the community development needs of its assessment areas through community development loans, qualified investments, and the provision of community development services. Examiners considered the institution’s capacity, as well as the need and availability of opportunities in the assessment areas.
DESCRIPTION OF INSTITUTION
CSB is a commercial bank headquartered in Edgewood, Iowa, which is located in eastern Iowa. CSB is wholly-owned by Community Financial Corporation of Edgewood, Iowa. CSB received a Satisfactory rating at its previous FDIC Performance Evaluation, dated May 15, 2018, which was performed using Interagency Intermediate Small Institution Examination Procedures. CSB currently operates from 10 full-service offices distributed amongst three assessment areas in eastern Iowa. The institution closed a branch office in Greeley, Iowa on February 14, 2020, but there was no impact to the bank’s assessment areas.
CSB offers various loan products including agricultural, commercial, home mortgage, and consumer loans. CSB’s primary focus is on agricultural lending, with a secondary focus on commercial lending. The bank also offers financing alternatives through the following loan programs: Small Business Administration (SBA), United States Department of Agriculture (USDA) Rural Development, Farm Service Agency, Federal Housing Administration, Veterans Administration, Federal Home Loan Bank Homeownership grants, and Iowa Finance Authority.
These programs are generally designed to assist small businesses, small farmers, veterans, and low- or moderate-income individuals who may not qualify for loans through conventional financing methods. Secondary market financing options are available for qualifying borrowers. The bank also participated in the SBA’s Paycheck Protection Program (PPP) during the review period. This program provided financial aid to businesses impacted by closings resulting from the COVID-19 pandemic.
The institution provides a variety of deposit products including checking, savings, and certificates of deposit. CSB participates in the Certificate of Deposit Account Registry Services program, and offers trust and wealth management services. Alternative banking services include internet banking, bill pay services, telephone banking, mobile banking, mobile deposit, and night deposit facilities. CSB also operates deposit-taking ATMs located at all 10 bank locations, as well as interactive teller machines at the Mount Vernon Road, Guttenberg, and Manchester branch locations.
Assets totaled approximately $501.0 million as of March 31, 2021, representing an increase of 16.3 percent since the March 31, 2017, Consolidated Reports of Condition and Income (Call Report).
Total deposits equaled approximately $405.4 million, representing a 15.8 percent increase, and total loans were approximately $344.5 million, representing an increase of 6.5 percent during the same timeframe. Portfolio concentrations have remained generally consistent, though commercial lending has increased approximately 10.3 percent over the period reviewed. Management attributed the growth in loans and deposits to stimulus and PPP activity, as well as organic growth occurring as a result of normal operations. Though commercial lending activity in the portfolio has surpassed agricultural lending overall, management again attributed the increase to the influx of temporary PPP loan activity and stated that the institution’s lending focus is still primarily agricultural in nature. The composition of the loan portfolio is illustrated in the following table.
|
Loan Portfolio Distribution as of 3/31/2020 |
||
|
Loan Category |
$(000s) |
% |
|
Construction, Land Development, and Other Land Loans |
9,974 |
2.9 |
|
Secured by Farmland |
76,815 |
22.3 |
|
Secured by 1-4 Family Residential Properties |
37,574 |
10.9 |
|
Secured by Multifamily (5 or more) Residential Properties |
7,812 |
2.3 |
|
Secured by Nonfarm Nonresidential Properties |
86,509 |
25.1 |
|
Total Real Estate Loans |
218,684 |
63.5 |
|
Commercial and Industrial Loans |
66,142 |
19.2 |
|
Agricultural Production and Other Loans to Farmers |
43,316 |
12.6 |
|
Consumer Loans |
9,751 |
2.8 |
|
Obligations of State and Political Subdivisions in the U.S. |
1,469 |
0.4 |
|
Other Loans |
5,114 |
1.5 |
|
Lease Financing Receivable (net of unearned income) |
0 |
0.0 |
|
Less: Unearned Income |
0 |
0.0 |
|
Total Loans |
344,476 |
100.0 |
|
Source: Call Report |
||
Examiners did not identify any financial, legal, or other impediments that affect the bank’s ability to meet the credit or community development needs of its assessment areas.
DESCRIPTION OF ASSESSMENT AREAS
The CRA requires each financial institution to define one or more assessment areas within which its CRA performance will be evaluated. CSB has defined three assessment areas within the state of Iowa, and the rating stated in this performance evaluation is an overall rating of the institution’s performance in those assessment areas. Refer to the discussion regarding each individual assessment area for detailed information.
SCOPE OF EVALUATION
General Information
This evaluation covers the period from the prior evaluation dated May 15, 2018, to the current evaluation date of May 24, 2021. Examiners used the Interagency Intermediate Small Institution Examination Procedures to evaluate CSB’s CRA performance. These procedures include the Lending and Community Development Tests, which are described in detail in the Appendix.
Examiners conducted full-scope reviews of the institution’s assessment areas to evaluate performance. As shown in the following table, the vast majority of CSB’s loans, deposits, and branches are in the Non-Metro Assessment Area. Therefore, the institution’s performance in the Non-Metro Assessment Area received the most weight in the overall evaluation. The following table reflects the distribution of reported loans, deposits, and office locations in each assessment area.
|
Assessment Area Breakdown of Loans, Deposits, and Branches |
||||||||
|
Assessment Area |
Loans |
Deposits |
Branches |
|||||
|
# |
% |
$(000s) |
% |
$(000s) |
% |
# |
% |
|
|
Non-Metro |
3,520 |
63.7 |
217,337 |
63.8 |
268,942 |
69.7 |
5 |
50 |
|
Cedar Rapids Metro |
1,190 |
21.5 |
90,914 |
26.7 |
103,419 |
26.8 |
4 |
40 |
|
Dubuque Metro |
817 |
14.8 |
32,622 |
9.5 |
13,688 |
3.5 |
1 |
10 |
|
Total |
5,527 |
100.0 |
340,873 |
100.0 |
386,049 |
100.0 |
1 |
100.0 |
|
Source: Bank Records as of 5/4/2021; FDIC Summary of Deposits (6/30/2020) |
||||||||
Activities Reviewed
Examiners determined that the institution’s major product lines are agricultural, commercial, and residential real estate loans. This conclusion was based on the institution’s business strategy, loan portfolio distribution, and institution records regarding the number and dollar volume of loans originated or renewed during the evaluation period. Therefore, examiners reviewed small farm, small business, and home mortgage lending for this evaluation. Overall, small farm lending received the greatest weight in the Non-Metro and Dubuque Metro assessment areas due to management’s stated business focus on agricultural lending in those locations. Small farm lending was not reviewed in the Cedar Rapids Metro Assessment Area, given management’s stated business focus of commercial lending in that assessment area and very limited activity during the review period.
For the Assessment Area Concentration review, examiners evaluated lending performance based on all small farm and small business loans originated or renewed in calendar year 2020, which management indicated was indicative of lending over the entire evaluation period, as well as home mortgage loan data collected under the Home Mortgage Disclosure Act (HMDA) for 2018, 2019, and 2020. For the Geographic Distribution review, examiners evaluated lending performance based on all small business loans originated or renewed inside the Cedar Rapids Metro Assessment Area in calendar year 2020, as well as home mortgage loan data originated or purchased inside the assessment area in 2018, 2019, and 2020. The Geographic Distribution criterion was not evaluated for the Non-Metropolitan or Dubuque Metro assessment areas because there are no low- or moderate-income geographies in those areas; therefore, an analysis would not yield meaningful results. Examiners evaluated Borrower Profile performance for small farm and small business lending using a sample of loans originated inside the reviewed assessment areas in 2020 for applicable loan products. However, due to limited lending activity in the Dubuque Metro Assessment Area, examiners reviewed the entire universe of small farm and small business loans originated inside the assessment area. The Borrower Profile analysis included all home mortgage loans, within each assessment area. Details are discussed in the applicable assessment area sections. The following table provides universe and sample information.
|
Loan Products Reviewed |
||||
|
Loan Category |
Universe |
Sampled |
||
|
# |
$(000s) |
# |
$(000s) |
|
|
Small Farm* |
312 |
34,772 |
79 |
10,553 |
|
Small Business* |
337 |
38,872 |
92 |
10,398 |
|
HMDA 2018 |
263 |
26,611 |
|
|
|
HMDA 2019 |
294 |
34,957 |
|
|
|
HMDA 2020 |
726 |
113,025 |
|
|
|
Source: * 2020 Bank Data; 2018-2020 HMDA Reported Data |
||||
For small farm and small business conclusions, 2020 D&B data provided a standard of comparison. When arriving at home mortgage conclusions, 2015 ACS Census data and HMDA aggregate lending data provided a standard of comparison. Examiners primarily focused on CSB’s lending performance in comparison to HMDA aggregate data, when available, as this is typically a better indicator of market conditions and loan demand in the assessment areas. Regarding lending performance for home mortgage, this evaluation presents information for 2019, the most recent year for which aggregate lending data is available. HMDA data for 2018 and 2020 was reviewed to ensure that performance was consistent with 2019. Commentary may be included relating to 2018 and 2020 data to support performance conclusions.
Examiners obtained the data necessary for this evaluation from reported loan data, other institution records, individual customer loan files, interviews with institution management, and other information gathered as part of the examination process. Examiners analyzed lending performance by both the number and dollar volume of loans; however, the performance by number of loans is emphasized, as it is generally a better indicator of the number of small farms, small businesses, and individuals served.
For the Community Development Test, examiners reviewed management-presented data on community development loans, qualified investments, and community development services provided since the prior CRA evaluation.
Effective March 1, 2020, the United States declared a national emergency concerning the COVID- 19 outbreak, which greatly influenced the economy. Unless otherwise noted, the economic impact of the pandemic on the assessment areas is unknown due to a lag in published data. The pandemic caused every state in the U.S. to be declared a disaster area in 2020. There were also other weather- related disasters declared during the review period that affected certain assessment area counties.
CONCLUSIONS ON PERFORMANCE CRITERIA
LENDING TEST
CSB demonstrated satisfactory performance under the Lending Test. The institution’s performance under the Loan-to-Deposit Ratio, Assessment Area Concentration, Geographic Distribution, and Borrower Profile criteria support this conclusion. The following is a discussion of each performance criterion and their support for the institution’s overall rating.
Loan-to-Deposit Ratio
CSB’s loan-to-deposit ratio is reasonable, given the institution’s size, financial condition, and assessment areas’ credit needs. The institution’s net loan-to-deposit ratio, calculated from Call Report data, averaged 86.2 percent over the 12 calendar quarters from June 30, 2018, to March 31, 2021. The net loan-to-deposit ratio ranged from a high of 90.4 percent as of September 30, 2018, to a low of 83.9 percent as of December 31, 2020. The ratio has been relatively steady over the period reviewed, as total deposits and net loans have generally made gains and reductions in tandem over the reported quarters, though total deposits have grown more than net loans, leading to a slight decline in the ratio, overall.
Examiners compared CSB’s average net-loan-to-deposit ratio with those of three similarly-situated institutions to evaluate CSB’s performance. Comparable institutions were selected based on similarities in lending focus, asset size, and markets served. As shown in the following table, CSB’s ratio is similar to comparable institutions.
|
Loan to Deposit Ratio Comparison |
||
|
Bank |
Total Assets as of 3/31/2021 $ (000s) |
Average Net Loan to Deposit Ratio (%) |
|
Community Savings Bank, Edgewood, Iowa |
500,980 |
86.2 |
|
BankIowa, Cedar Rapids, Iowa |
779,435 |
96.5 |
|
FreedomBank, Elkader, Iowa |
477,448 |
97.6 |
|
Citizens State Bank, Monticello, Iowa |
461,116 |
64.3 |
|
Source: Call Reports 6/30/18 through 3/31/21 |
||
The institution also has the ability to originate mortgage loans that are subsequently sold through secondary market relationships; these loans are not included in the institution’s ratio. CSB reported originating 808 loans totaling approximately $133.3 million sold on the secondary market from May 15, 2020, to December 31, 2020. While the sale of secondary market loans does not influence the average net loan-to-deposit ratio, this activity provides liquidity to originate additional home mortgage loans. Secondary market lending is responsive to the assessment areas’ credit needs by providing long-term home mortgage financing.
Assessment Area Concentration
CSB extended a majority of its small farm, small business, and home mortgage loans inside its assessment areas, by number and dollar amount, demonstrating a willingness to extend credit in the areas it serves. Please see the following table.
|
Lending Inside and Outside of the Assessment Area |
||||||||||
|
Loan Category |
Number of Loans |
|
Dollar Amount of Loans $(000s) |
|
||||||
|
Inside |
Outside |
Total |
Inside |
Outside |
Total |
|||||
|
# |
% |
# |
% |
# |
$ |
% |
$ |
% |
$(000s) |
|
|
Small Farm |
280 |
89.7 |
32 |
10.3 |
312 |
31,840 |
91.6 |
2,932 |
8.4 |
34,772 |
|
Small Business |
261 |
77.4 |
76 |
22.6 |
337 |
28,529 |
73.4 |
10,343 |
26.6 |
38,872 |
|
Home Mortgage |
|
|||||||||
|
2018 |
220 |
83.7 |
43 |
16.4 |
263 |
20,516 |
77.1 |
6,096 |
22.9 |
26,611 |
|
2019 |
255 |
86.7 |
39 |
13.3 |
294 |
28,514 |
81.6 |
6,442 |
18.4 |
34,957 |
|
2020 |
591 |
81.4 |
135 |
18.6 |
726 |
91,145 |
80.6 |
21,880 |
19.4 |
113,025 |
|
Subtotal |
1,066 |
83.1 |
217 |
16.9 |
1,283 |
140,175 |
80.3 |
34,418 |
19.7 |
174,593 |
|
Source: Bank Data Due to rounding, totals may not equal 100.0% |
||||||||||
Geographic Distribution
The geographic distribution of loans reflects reasonable dispersion throughout the assessment areas. Examiners considered the percentage, by number, of loans in low- and moderate-income census tracts located in the Cedar Rapids Metro Assessment Area. The Non-Metro and Dubuque Metro assessment areas do not include any low- or moderate-income geographies, and a review of the Geographic Distribution criterion would not result in meaningful conclusions; therefore, this criterion was not evaluated in those areas.
Borrower Profile
Overall, the distribution of borrowers reflects reasonable penetration among farms and businesses of differing revenue sizes, as well as individuals of differing income levels. The institution’s reasonable lending performance in each assessment area supports this conclusion. Examiners focused on the percentage, by number, of loans, to farms and businesses with gross annual revenues of $1 million or less, as well as low- and moderate-income home mortgage borrowers.
Response to Complaints
The institution has not received any CRA-related complaints since the previous evaluation; therefore, this criterion did not affect the Lending Test rating.
COMMUNITY DEVELOPMENT TEST
The institution’s community development performance demonstrates adequate responsiveness to community development needs of the assessment areas through community development loans, qualified investments, and the provision of community development services. CSB’s activities support community development primarily through economic development efforts that create or retain employment; the institution has also provided support for affordable housing, community services targeted to low-and moderate-income individuals, and efforts to revitalize or stabilize low- and moderate-income or underserved middle-income geographic areas. Community development
activities that benefitted the broader statewide and/or regional area were included in the analysis, as the institution adequately responded to the needs of its assessment areas.
Information from performance evaluations of three comparable intermediate small institutions conducted during the review period was used to assess CSB’s overall performance under the Community Development Test. These institutions were chosen because of similarities in asset size, business focus, and types of assessment areas served. Overall, CSB’s performance compared favorably to the performance of these institutions.
Community Development Loans
CSB originated 1,349 community development loans totaling approximately $55.9 million during the evaluation period, which represents 16.4 percent of net loans and 11.2 percent of total assets, as of March 31, 2021. These ratios have increased significantly since the previous evaluation when community development loans represented 1.5 percent of net loans and 1.1 percent of total assets. The majority of this growth is attributed to lending conducted as part of the SBA’s PPP, which was designed to help businesses keep their workforce employed during the pandemic. However, exclusive of PPP loans, the bank’s performance significantly declined, with 53 community development loans totaling approximately $1.3 million during the current review period, compared to 125 loans totaling $4.9 million at the prior evaluation.
The referenced comparable intermediate small institutions were last evaluated with PPP loans; therefore, ratios derived from data including the PPP loans were compared. CSB compared very well with the similarly-situated institutions whose community development loans ranged from 5.7 percent to 8.4 percent of net loans, and 3.4 percent to 6.7 percent of total assets. The following tables reflect the number and dollar volume of community development lending in each category by assessment area and activity year. These tables also identify lending activities in the broader statewide or regional areas that received consideration.
|
Community Development Lending by Assessment Area |
||||||||||
|
Assessment Area |
Affordable Housing |
Community Services |
Economic Development |
Revitalize or Stabilize |
Totals |
|||||
|
# |
$(000s) |
# |
$(000s) |
# |
$(000s) |
# |
$(000s) |
# |
$(000s) |
|
|
Non-Metro |
0 |
0 |
0 |
0 |
758 |
28,236 |
1 |
20 |
759 |
28,256 |
|
Cedar Rapids Metro |
0 |
0 |
0 |
0 |
408 |
14,463 |
0 |
0 |
408 |
14,463 |
|
Dubuque Metro |
0 |
0 |
0 |
0 |
165 |
3,240 |
0 |
0 |
165 |
3,240 |
|
Total in Assessment Areas |
0 |
0 |
0 |
0 |
1,331 |
45,939 |
1 |
20 |
1332 |
45,959 |
|
Regional Activities |
1 |
91 |
0 |
0 |
11 |
9,797 |
5 |
69 |
17 |
9,957 |
|
Total |
1 |
91 |
0 |
0 |
1,342 |
55,736 |
6 |
89 |
1,349 |
55,916 |
|
Source: Bank Data |
||||||||||
|
Community Development Lending |
||||||||||
|
Activity Year |
Affordable Housing |
Community Services |
Economic Development |
Revitalize or Stabilize |
Totals |
|||||
|
# |
$(000s) |
# |
$(000s) |
# |
$(000s) |
# |
$(000s) |
# |
$(000s) |
|
|
2018 (Partial) |
0 |
0 |
0 |
0 |
15 |
255 |
4 |
63 |
19 |
318 |
|
2019 |
1 |
91 |
0 |
0 |
21 |
722 |
2 |
26 |
24 |
839 |
|
2020 |
0 |
0 |
0 |
0 |
567 |
35,965 |
0 |
0 |
567 |
35,965 |
|
YTD 2021 |
0 |
0 |
0 |
0 |
739 |
18,794 |
0 |
0 |
739 |
18,794 |
|
Total |
1 |
91 |
0 |
0 |
1,342 |
55,736 |
6 |
89 |
1,349 |
55,916 |
|
Source: Bank Data |
||||||||||
Examples of the CSB’s community development loan activities, where the institution has shown exceptional responsiveness, are discussed in the individual assessment area sections, if applicable. If no discussion is noted, then the institution’s performance in that assessment area was not unique and was similar to community development lending observed at other institutions.
Qualified Investments
The institution made 105 qualified investments totaling approximately $8.6 million during the evaluation period, which represents 1.7 percent of total assets and 8.75 percent of total securities, as of March 31, 2021. This represents a decrease in volume from the previous evaluation, when the percentages of total assets and total securities were 2.2 and 13.2 percent, respectively. Qualified investment activity included 78 donations totaling approximately $87,000, as well as 16 investments made in a prior period that had outstanding balances of approximately $3.6 million as of this evaluation date. Comparable institutions reported qualifying investment activity that ranged from 0.9 to 1.4 percent of total assets and 5.7 to 18.6 percent of total securities. CSB compares reasonably to these institutions. Please see the following tables.
|
Community Development Qualified Investments by Assessment Area |
||||||||||
|
Assessment Area |
Affordable Housing |
Community Services |
Economic Development |
Revitalize or Stabilize |
Totals |
|||||
|
# |
$(000s) |
# |
$(000s) |
# |
$(000s) |
# |
$(000s) |
# |
$(000s) |
|
|
Non-Metro |
0 |
0 |
0 |
0 |
6 |
1 |
68 |
2,098 |
74 |
2,099 |
|
Cedar Rapids Metro |
0 |
0 |
2 |
1 |
4 |
6 |
3 |
1 |
9 |
8 |
|
Dubuque Metro |
0 |
0 |
0 |
0 |
0 |
0 |
0 |
0 |
0 |
0 |
|
Assessment Areas Subtotal |
0 |
0 |
2 |
1 |
10 |
7 |
71 |
2,099 |
83 |
2,107 |
|
Regional Activities |
0 |
0 |
0 |
0 |
0 |
0 |
22 |
6,453 |
22 |
6,453 |
|
Total |
0 |
0 |
2 |
1 |
10 |
7 |
93 |
8,552 |
105 |
8,560 |
|
Source: Bank Records |
||||||||||
|
Qualified Investments |
||||||||||
|
Activity Year |
Affordable Housing |
Community Services |
Economic Development |
Revitalize or Stabilize |
Totals |
|||||
|
# |
$(000s) |
# |
$(000s) |
# |
$(000s) |
# |
$(000s) |
# |
$(000s) |
|
|
Prior Period |
0 |
0 |
0 |
0 |
0 |
0 |
16 |
3,598 |
16 |
3,598 |
|
2018 (Partial) |
0 |
0 |
0 |
0 |
0 |
0 |
4 |
975 |
4 |
975 |
|
2019 |
0 |
0 |
0 |
0 |
0 |
0 |
5 |
2,632 |
5 |
2,632 |
|
2020 |
0 |
0 |
0 |
0 |
0 |
0 |
2 |
1,268 |
2 |
1,268 |
|
2021 (YTD) |
0 |
0 |
0 |
0 |
0 |
0 |
0 |
0 |
0 |
0 |
|
Subtotal |
0 |
0 |
0 |
0 |
0 |
0 |
27 |
8,473 |
27 |
8,473 |
|
Qualified Grants & Donations |
0 |
0 |
2 |
1 |
10 |
7 |
66 |
79 |
78 |
87 |
|
Total |
0 |
0 |
2 |
1 |
10 |
7 |
93 |
8,552 |
105 |
8,560 |
|
Source: Bank Records |
||||||||||
Examples of the CSB’s qualified investment activities, where the institution has shown exceptional responsiveness, are discussed in the individual assessment area sections, if applicable. If no discussion is noted, then the institution’s performance in that assessment area was not unique and was similar to qualifying investments observed at other institutions.
Community Development Services
The bank received consideration for a total of 70 community development services that primarily consisted of providing support to organizations that provide economic development or revitalization or stabilization efforts in the assessment areas. CSB personnel provided technical or financial expertise to these organizations in many ways, all related to the same or similar skills used in their employment with the institution. Multiple employees have dedicated their time and resources to 25 different organizations over the review period. Most employees providing qualified services did so in an officer, president, or Board member capacity. The number of services and organizations served has slightly decreased since the prior evaluation, when the institution received consideration for a total of 86 community development services serving 30 different entities.
Similarly-situated institutions provided a range of 24 to 75 community development services; CSB compares favorably to these institutions. The following tables illustrate the bank’s community development services in each category by assessment area and activity year.
|
Community Development Services by Assessment Area |
|||||
|
Assessment Area |
Affordable Housing |
Community Services |
Economic Development |
Revitalize or Stabilize |
Total |
|
# |
# |
# |
# |
# |
|
|
Non-Metro |
5 |
5 |
16 |
34 |
60 |
|
Cedar Rapids Metro |
0 |
1 |
1 |
0 |
2 |
|
Dubuque Metro |
0 |
0 |
8 |
0 |
8 |
|
Total |
5 |
6 |
25 |
34 |
70 |
|
Source: Bank Data |
|||||
|
Community Development Services |
|||||
|
Year |
Affordable Housing |
Community Services |
Economic Development |
Revitalize or Stabilize |
Total |
|
# |
# |
# |
# |
# |
|
|
2018 (Partial) |
2 |
4 |
5 |
10 |
21 |
|
2019 |
2 |
1 |
7 |
9 |
19 |
|
2020 |
1 |
0 |
7 |
8 |
16 |
|
2021 (YTD) |
0 |
1 |
6 |
7 |
14 |
|
Total |
5 |
6 |
25 |
34 |
70 |
|
Source: Bank Data |
|||||
The bank offers various small business and personal retail credit and deposit products, including a number of no- or low-cost accounts for business and retail customers. A transactional website is maintained, through which consumers can access online banking, permitting them to check account balances, transfer funds between accounts, and pay bills. Electronic access is also available through mobile banking and electronic statements. These services are generally free of charge to bank customers, which is beneficial to low- and moderate-income individuals.
As mentioned previously, the bank participates in various lending programs that aid small businesses, small farms, and potential homeowners. CSB also implemented the following measures to accommodate customers affected by the COVID-19 pandemic. Such efforts are considered highly responsive to the needs of low- and moderate-income individuals, small businesses, and small farms affected by the pandemic:
- Loan modifications upon request
- Overdraft fees waived upon request
- Extended information and assistance to customers regarding stimulus check deposits
- Free cash advances on the debit cards that were issued for the relief checks to customers and non-customers
- Waived fees for any purchases or loads of gift cards and travel cards in April
- Developed the “Skip-a-Pay” program, allowing consumer loan customers to forgo one payment in the month of April or May 2020, upon request. There were 188 participants in the program, 52 percent of which were identified as low- or moderate-income
Retail banking services and loan programs are consistent among all of CSB’s assessment areas. Two branch offices, two ATMs, and one interactive teller machine are located in underserved middle-income geographies. Other qualitative examples of community development services where the bank has been the most responsive are discussed in the individual assessment area sections of this evaluation, if applicable.
DISCRIMINATORY OR OTHER ILLEGAL CREDIT PRACTICES REVIEW
Examiners did not identify any evidence of discriminatory or other illegal credit practices inconsistent with helping meet community credit needs.
NON-METRO ASSESSMENT AREA – Full-Scope Review
DESCRIPTION OF INSTITUTION’S OPERATIONS IN THE NON-METRO ASSESSMENT AREA
The Non-Metro Assessment Area consists of Clayton and Delaware counties in their entirety, which are non-metropolitan in nature. CSB operates from five offices in the assessment area, which are located in Edgewood, Earlville, Garnavillo, Guttenberg, and Manchester, all in Iowa.
Economic and Demographic Data
According to 2015 ACS Census data, the assessment area consists of 10 census tracts, which includes 9 middle- and 1 upper-income census tracts. The following table illustrates the selected demographic characteristics of the Non-Metro Assessment Area.
|
Demographic Information of the Assessment Area |
|||||||
|
Assessment Area: Non-Metro |
|||||||
|
Demographic Characteristics |
# |
Low % of # |
Moderate % of # |
Middle % of # |
Upper % of # |
NA* % of # |
|
|
Geographies (Census Tracts) |
10 |
0.0 |
0.0 |
90.0 |
10.0 |
0.0 |
|
|
Population by Geography |
35,313 |
0.0 |
0.0 |
91.7 |
8.3 |
0.0 |
|
|
Housing Units by Geography |
17,056 |
0.0 |
0.0 |
92.4 |
7.6 |
0.0 |
|
|
Owner-Occupied Units by Geography |
11,545 |
0.0 |
0.0 |
91.2 |
8.8 |
0.0 |
|
|
Occupied Rental Units by Geography |
3,036 |
0.0 |
0.0 |
93.5 |
6.5 |
0.0 |
|
|
Vacant Units by Geography |
2,475 |
0.0 |
0.0 |
96.2 |
3.8 |
0.0 |
|
|
Businesses by Geography |
3,182 |
0.0 |
0.0 |
91.6 |
8.4 |
0.0 |
|
|
Farms by Geography |
747 |
0.0 |
0.0 |
90.4 |
9.6 |
0.0 |
|
|
Family Distribution by Income Level |
10,018 |
17.9 |
17.1 |
23.4 |
41.5 |
0.0 |
|
|
Household Distribution by Income Level |
14,581 |
20.3 |
16.6 |
19.5 |
43.6 |
0.0 |
|
|
Median Family Income, Non-Metropolitan Statistical Areas (MSAs) - IA |
$61,681 |
Median Housing Value |
$119,229 |
||||
|
|
Median Gross Rent |
$572 |
|||||
|
Families Below Poverty Level |
6.9% |
||||||
|
Source: 2015 ACS; 2020 D&B Data Due to rounding, totals may not equal 100.0% (*) The NA category consists of geographies that have not been assigned an income classification. |
|||||||
According to D&B Data, there are 747 agricultural operations and 3,182 businesses in the assessment area. Service industries represent the largest portion of businesses (by number) at 28.8 percent; followed by agriculture, forestry, and fishing at 19.0 percent; and non-classifiable establishments at 14.0 percent. Additionally, 70.0 percent of businesses in the assessment area have four or fewer employees, and 90.8 percent operate from a single location. The assessment area is
primarily rural in nature and serves to support management’s emphasis on agricultural lending. Management noted that agricultural businesses were not greatly affected by the pandemic, but other businesses (especially those relying on in-person traffic) such as restaurants, small shops, and other businesses in the area were affected by the initial shutdown and subsequent operations under reduced-capacity governmental orders. In addition, businesses were adversely affected by online product sales of competitors, if they did not have an online sales capability. Though the local economy is recovering, residual effects of the pandemic are still being felt in the business community.
The FFIEC estimated median family income levels are used to analyze home mortgage loans under the Borrower Profile criterion and to analyze certain community development activities related to housing. The low-, moderate-, middle, and upper-income categories for non-metropolitan areas of Iowa are detailed in the table below.
|
Median Family Income Ranges |
||||
|
Median Family Incomes |
Low <50% |
Moderate 50% to <80% |
Middle 80% to <120% |
Upper ≥120% |
|
IA Non-Metropolitan Median Family Income |
||||
|
2018 ($67,800) |
<$33,900 |
$33,900 to <$54,240 |
$54,240 to <$81,360 |
≥$81,360 |
|
2019 ($66,900) |
<$33,450 |
$33,450 to <$53,520 |
$53,520 to <$80,280 |
≥$80,280 |
|
2020 ($69,200) |
<$34,600 |
$34,600 to <$55,360 |
$55,360 to <$83,040 |
≥$83,040 |
|
Source: FFIEC |
||||
Competition
The assessment area is moderately competitive regarding the market for financial services. The FDIC Deposit Market Share Report as of June 30, 2020, reported 12 institutions operating from 26 locations within the assessment area. These institutions range in size from small community banks to larger financial institutions with branch locations in the assessment area. CSB ranks second in the assessment area with 12.0 percent market share.
Community Contacts
As part of the evaluation process, examiners contact third parties active in the assessment area to help identify the credit needs and economic conditions of the assessment area. This information helps determine whether local financial institutions are responsive to community credit needs, and provides context regarding available opportunities for area financial institutions. In conjunction with this evaluation, examiners reviewed one existing community contact interview and conducted another with individuals who have specific knowledge of the economic conditions of the assessment area.
The contacts stated that the main economic driver in the assessment area is the agricultural economy, and most of the activity in the assessment area is tied to the agricultural economy in one form or another. The agricultural sector has generally been stable, and the recent pandemic has not greatly affected agricultural producers. Commodity prices are edging higher, but so are the cost of inputs. Consolidation of farming operations continues, though not at the pace it had pre-pandemic. It is hard to enter the farming market, as available land is scarce. Commercial entities were
generally stable with very limited business closures or layoffs in recent years (aside from the effects of the pandemic). Delaware County experienced an expansion of manufacturing activities. Service and retail businesses offer some employment opportunities, as well. Though unemployment was high during the initial months of the pandemic, it has been reduced of late. Some individuals commute to larger cities. The contacts stated that there is a need for more affordable housing units in the assessment area, and that some housing construction has begun in anticipation of announced manufacturing expansions. The contacts also stated that there are no unmet credit needs in the area and financial institutions are willing to provide credit.
Credit and Community Development Needs and Opportunities
Considering information from the community contacts, bank management, and demographic and economic data, examiners determined that small business, small farm, and home mortgage loans are primary credit needs of the assessment area. Call Reports filed by area financial institutions also support this assertion. Further, opportunities for community development exist in the area.
CONCLUSIONS ON PERFORMANCE CRITERIA IN THE NON-METRO ASSESSMENT AREA
LENDING TEST
The institution demonstrated reasonable performance under the Lending Test in the Non-Metro Assessment Area, which is supported by the results of the Borrower Profile criterion.
Geographic Distribution
The Non-Metro Assessment Area does not contain any low- or moderate-income geographies; therefore, examiners did not evaluate the geographic distribution of loans, as a review would not have resulted in meaningful conclusions.
Borrower Profile
The distribution of borrowers reflects reasonable penetration among farms and businesses of different revenue sizes and individuals of different income levels. The institution’s reasonable performance in each loan category supports this conclusion.
Small Farm Lending
The distribution of borrowers reflects reasonable penetration among farms of different revenue sizes. The initial review showed that the institution’s level of lending is substantially below that of D&B benchmark data; however, further review showed an anomaly in the random sample. Specifically, of the 16 loans to farm with gross annual revenues of over $1 million, 14 of them were made to two entities, thus inflating the percentage in that category. Management indicated that one of the customers had five loans and was originally smaller than $1 million gross annual revenues at the beginning of the banking relationship and grew larger over time. The borrower with nine of the loans is a cattle operation, which typically have higher revenue streams than other agricultural operations in the area.
In addition to the sample anomaly, the USDA 2017 Census of Agriculture shows that 53.8 percent of agricultural producers in the assessment area are “hobby farms,” which list their principal occupation as “other than farming.” The same report shows that 46.5 percent of farm operations in the assessment area had no interest expense, indicating that a significant portion of producers in the area have limited or no need for credit. Finally, 2019 CRA aggregate data shows that 42.0 percent of loans made inside this assessment area, by institutions required to report small farm loan data, were originated to small farms reporting revenues of $1 million or less. Given the additional context, the institution’s lending is reasonable.
|
Distribution of Small Farm Loans by Gross Annual Revenue Category |
|||||
|
Assessment Area: Non-Metro |
|||||
|
Gross Revenue Level |
% of Farms |
# |
% |
$(000s) |
% |
|
<=$1,000,000 |
98.4 |
32 |
60.4 |
4,401 |
68.1 |
|
>$1,000,000 |
0.8 |
16 |
30.2 |
1,913 |
29.6 |
|
Revenue Not Available |
0.8 |
5 |
9.4 |
148 |
2.3 |
|
Total |
100.0 |
53 |
100.0 |
6,462 |
100.0 |
|
Source: 2020 D&B Data; Bank Data. Due to rounding, totals may not equal 100.0% |
|||||
Small Business Lending
The distribution of borrowers reflects reasonable penetration among businesses of different revenue sizes. As shown in the following table, the bank’s percentage of sampled loans to small businesses with gross annual revenues of $1 million or less is lower than comparable D&B data, but reasonable when considering competition. Though 12 institutions operate from 26 locations in this assessment area, 2019 CRA aggregate data shows that 34 lending institutions reported 535 small business loans;
46.7 percent of those borrowers reported revenues of $1 million or less. Management stated that competition from institutions inside and outside the assessment area is a factor. In addition, 2 of the 8 loans to entities of over $1 million were to the same borrower, and that particular borrower is a long- time customer who has grown into that revenue category over time. Given the additional context, the institution’s lending is reasonable.
|
Distribution of Small Business Loans by Gross Annual Revenue Category |
|||||
|
Assessment Area: Non-Metro |
|||||
|
Gross Revenue Level |
% of Businesses |
# |
% |
$(000s) |
% |
|
<=$1,000,000 |
84.6 |
24 |
66.7 |
1,510 |
49.5 |
|
>$1,000,000 |
4.2 |
8 |
22.2 |
1,182 |
38.7 |
|
Revenue Not Available |
11.2 |
4 |
11.1 |
360 |
11.8 |
|
Total |
100.0 |
36 |
100.0 |
3,052 |
100.0 |
|
Source: 2020 D&B Data; Bank Data. Due to rounding, totals may not equal 100.0% |
|||||
Home Mortgage Lending
CSB’s performance in extending home mortgage loans to borrowers of differing income levels is reasonable. As shown in the table below, the institution’s performance in lending to low-income borrowers in 2019 is slightly above that of aggregate lending data. Lending to moderate income borrowers was slightly above that of aggregate lending data.
|
Distribution of Home Mortgage Loans by Borrower Income Level |
||||||
|
Assessment Area: Non-Metro |
||||||
|
Borrower Income Level |
% of Families |
Aggregate Performance % of # |
# |
% |
$(000s) |
% |
|
Low |
17.9 |
7.3 |
18 |
10.9 |
795 |
4.8 |
|
Moderate |
17.1 |
21.5 |
38 |
23.0 |
2,976 |
17.9 |
|
Middle |
23.4 |
23.2 |
42 |
25.5 |
3,758 |
22.6 |
|
Upper |
41.5 |
35.7 |
55 |
33.3 |
7,562 |
45.4 |
|
Not Available |
0.0 |
12.3 |
12 |
7.3 |
1,554 |
9.3 |
|
Total |
100.0 |
100.0 |
165 |
100.0 |
16,646 |
100.0 |
|
Source: 2015 ACS; Bank Data; 2019 HMDA Aggregate Data. Due to rounding, totals may not equal 100.0% |
||||||
COMMUNITY DEVELOPMENT TEST
CSB’s performance regarding community development demonstrates adequate responsiveness to the needs of this assessment area, considering the institution’s capacity, as well as the need and availability of such community development opportunities.
Community Development Loans
The bank originated 759 community development loans totaling approximately $28.2 million in this assessment area. Excluding the 713 PPP loans totaling approximately $27.1 million, the bank originated 46 community development loans totaling approximately $1.1 million. The level of community development lending decreased when compared to the previous evaluation, which included 100 loans totaling approximately $3.5 million. The bulk of the institution’s community development lending in this assessment area helped to provide or retain employment for low-to moderate-income individuals, thus promoting economic development. Overall, the institution saw a significant increase in community development lending that met assessment area needs when considering the impact of SBA PPP activity.
Qualified Investments
CSB made 74 qualifying investments totaling approximately $2.0 million in the Non-Metro Assessment Area. This is an increase from the prior evaluation, when the institution made 50 qualifying investments totaling approximately $1.0 million. The vast majority of investments and donations were made to revitalize and stabilize certain geographies within the assessment area.
Examples of sizable investments made that demonstrate exceptional responsiveness to the needs of the assessment area include:
- $1 million investment in a bond for a city in an underserved area to fund street repairs and purchase a fire truck.
- A sizeable donation was made to a firefighters association in an underserved area to help fund a new fire station.
- Several sizeable donations were made to organizations in an underserved area to promote business, economic viability, and industrial parks.
Community Development Services
The bank received consideration for a total of 60 community development services that primarily consisted of bank employees providing financial expertise to community service-related organizations within the Non-Metro Assessment Area. The number of community development services decreased from the prior evaluation, when 86 community development services were provided. A majority of the services provided in this assessment area were targeted toward revitalization and/or stabilization efforts in geographies designated as underserved, which have a population density so small, thin, and distant from a population center that essential community needs may not be met. Several qualifying services targeted medical, emergency services, and other infrastructure needs.
CEDAR RAPIDS METRO ASSESSMENT AREA – Full-Scope Review
DESCRIPTION OF INSTITUTION’S OPERATIONS IN THE CEDAR RAPIDS METRO ASSESSMENT AREA
The Cedar Rapids Metro Assessment Area consists of Linn County in its entirety, which is part of the Cedar Rapids, Iowa, MSA. CSB operates from four offices in the assessment area, which are located in Cedar Rapids, Coggon, Marion, and Robins, all in Iowa.
Economic and Demographic Data
According to 2015 ACS Census data, the assessment are consists of 45 census tracts, which includes 2 low- 11 moderate-, 25 middle-, and 6 upper-income census tracts. One census tract in downtown Cedar Rapids does not have an income classification, as it is primarily land used by a college. The following table illustrates the selected demographic characteristics of the Cedar Rapids Metro Assessment Area.
|
Demographic Information of the Assessment Area Assessment Area: Cedar Rapids Metro |
||||||
|
Demographic Characteristics |
# |
Low % of # |
Moderate % of # |
Middle % of # |
Upper % of # |
NA* % of # |
|
Geographies (Census Tracts) |
45 |
4.4 |
24.4 |
55.6 |
13.3 |
2.2 |
|
Population by Geography |
216,640 |
1.8 |
19.8 |
59.1 |
18.0 |
1.4 |
|
Housing Units by Geography |
94,058 |
1.9 |
21.4 |
60.4 |
15.2 |
1.1 |
|
Owner-Occupied Units by Geography |
64,274 |
0.9 |
17.6 |
61.5 |
19.8 |
0.2 |
|
Occupied Rental Units by Geography |
23,044 |
4.0 |
31.2 |
56.9 |
4.9 |
3.1 |
|
Vacant Units by Geography |
6,740 |
3.8 |
24.7 |
62.8 |
6.2 |
2.4 |
|
Businesses by Geography |
18,866 |
4.3 |
16.5 |
54.1 |
19.9 |
5.3 |
|
Farms by Geography |
791 |
1.0 |
9.0 |
65.0 |
24.3 |
0.8 |
|
Family Distribution by Income Level |
54,653 |
18.6 |
17.7 |
23.8 |
39.9 |
0.0 |
|
Household Distribution by Income Level |
87,318 |
23.4 |
16.3 |
18.6 |
41.7 |
0.0 |
|
Median Family Income MSA - 16300 Cedar Rapids, IA MSA |
$75,812 |
Median Housing Value |
$149,515 |
|||
|
|
Median Gross Rent |
$676 |
||||
|
Families Below Poverty Level |
6.3% |
|||||
|
Source: 2015 ACS and 2020 D&B Data Due to rounding, totals may not equal 100.0% (*) The NA category consists of geographies that have not been assigned an income classification. |
||||||
According to D&B Data, there are 791 agricultural operations and 18,866 businesses in the assessment area. Service industries represent the largest portion of businesses (by number) at 36.8 percent, followed by non-classifiable establishments at 19.0 percent and retail trade at 11.3 percent. Additionally, 61.5 percent of businesses in the assessment area have four or fewer employees, and
89.1 percent operate from a single location. The assessment area is primarily commercial in nature and serves to support management’s emphasis on commercial lending. Management noted that businesses (especially those relying on in-person traffic) such as restaurants, small shops, and other businesses in the area were greatly affected by the initial pandemic shutdown and subsequent operations under reduced-capacity governmental orders. Businesses were adversely affected by online product sales of competitors if they did not have an online sales capability. Management also stated that the derecho windstorm of August 2020 and resulting power outages, infrastructure damage, and general devastation affected business and agricultural operations for an extended period. Although the local economy is now recovering from the effects of both events, residual effects are still being felt by business and agricultural entities.
The FFIEC estimated median family income levels are used to analyze home mortgage loans under the Borrower Profile criterion and to analyze certain community development activities related to housing. The low-, moderate-, middle, and upper-income categories for the Cedar Rapids Metro Assessment Area are detailed in the following table.
|
Median Family Income Ranges |
||||
|
Median Family Incomes |
Low <50% |
Moderate 50% to <80% |
Middle 80% to <120% |
Upper ≥120% |
|
Cedar Rapids, IA Metro Median Family Income (16300) |
||||
|
2018 ($80,800) |
<$40,400 |
$40,400 to <$64,640 |
$64,640 to <$96,960 |
≥$96,960 |
|
2019 ($88,000) |
<$44,000 |
$44,000 to <$70,400 |
$70,400 to <$105,600 |
≥$105,600 |
|
2020 ($83,600) |
<$41,800 |
$41,800 to <$66,880 |
$66,880 to <$100,320 |
≥$100,320 |
|
Source: FFIEC |
||||
Competition
The Cedar Rapids Metro Assessment Area is very competitive with regard to the market for financial services. The FDIC Deposit Market Share Report of June 30, 2020, indicates that there are 26 institutions operating from 72 locations in the assessment area. These institutions range in size from small community banks to larger financial institutions with branch locations in the assessment area. CSB ranks 13th, with 1.7 percent market share.
Community Contact
As part of the evaluation process, examiners conducted a community contact interview with an individual who has specific knowledge of the economic conditions of the assessment area.
The contact stated that the economy of the assessment area is generally stable. There is economic growth and unemployment is low. Recovery from the pandemic and the derecho windstorm of August 2020 is continuing. The agricultural sector has become stronger due to increasing commodity prices. Farmers are buying and improving equipment, which helps the manufacturing sector and other agriculture-related industries. Commercial development and industries in the assessment area are growing slowly, but steadily. One area of decline has been commercial office space, mainly due to the uncertainty of pandemic-related work-at-home policies continuing into the future. The contact stated that SBA PPP loans and other stimulus packages saved many small businesses in the area. Main street businesses in rural areas are struggling due to the preference of shoppers to go to larger retail areas. Low unemployment has had an effect on both agricultural and business employers, forcing wages up and making hiring harder for smaller entities. The residential real estate market has become much stronger over the past year. With new home inventory being low, high demand, and high construction input costs, the price of new housing has risen substantially. The refinance market is very robust due to low interest rates. Affordable housing is a need throughout the assessment area, but especially in rural areas. The contact stated that there are many opportunities for lending, investment, and services in the assessment area and local financial institutions are willing to meet the credit needs of the area.
Credit and Community Development Needs and Opportunities
Considering information from the community contact, bank management, and demographic and economic data, examiners determined that small business, small farm, and home mortgage loans (especially affordable housing) are primary credit needs of the assessment area. Call Reports filed by area financial institutions also support this assertion. Further, opportunities for community development exist in the area.
CONCLUSIONS ON PERFORMANCE CRITERIA IN THE CEDAR RAPIDS METRO ASSESSMENT AREA
LENDING TEST
The institution demonstrated reasonable performance under the Lending Test in the Cedar Rapids Metro Assessment Area, as supported by Geographic Distribution and Borrower Profile performance.
Geographic Distribution
CSB’s geographic distribution of loans reflects reasonable dispersion throughout the assessment area. The bank’s reasonable performance in the small business and home mortgage lending products support this conclusion.
Small Business Lending
The geographic distribution of small business lending reflects reasonable dispersion throughout the assessment area. The percentage of lending in the low-income areas of the assessment area mirrors that of the demographic benchmark, while the percentage of lending in moderate-income areas is slightly less than benchmark, but still reasonable. When considered collectively, penetration in the low- and moderate-income areas has improved since the previous evaluation. Please see the following table.
|
Geographic Distribution of Small Business Loans |
|||||
|
Assessment Area: Cedar Rapids Metro |
|||||
|
Tract Income Level |
% of Businesses |
# |
% |
$(000s) |
% |
|
Low |
4.3 |
3 |
4.2 |
117 |
1.2 |
|
Moderate |
16.5 |
8 |
11.1 |
1,801 |
18.6 |
|
Middle |
54.1 |
49 |
68.1 |
6,613 |
68.2 |
|
Upper |
19.9 |
10 |
13.9 |
1,093 |
11.3 |
|
Not Available |
5.3 |
2 |
2.8 |
79 |
0.8 |
|
Total |
100.0 |
72 |
100.0 |
9,703 |
100.0 |
|
Source: 2020 D&B Data; Bank Data Due to rounding, totals may not equal 100.0% |
|||||
Home Mortgage Lending
The geographic distribution of home mortgage lending reflects reasonable dispersion throughout the assessment area. The table below indicates that no loans were originated in the two low-income census tracts in the assessment area in 2019, while aggregate performance data indicates that other HMDA reporting institutions originated 1.2 percent of their home mortgage loans in those census tracts. CSB originated 2.4 percent of their home mortgage loans in those census tracts in both 2018 and 2020; the aggregate data benchmark for 2018 was 1.3 percent. Additionally, housing data for those two census tracts indicates that only 33 percent of all housing is owner-occupied, while 52 percent are occupied rental units and 15 percent are vacant units. This demonstrates that the opportunity to make home mortgage loans in these census tracts is limited. Home mortgage lending in the moderate-income census tracts was comparable to benchmark demographics in 2019.
Management stated that home mortgage lending is not the focus in this assessment area. As previously mentioned, CSB offers options for rehabilitation and other mortgage lending in specific, targeted areas of Cedar Rapids that include low- and moderate-income areas through a partnership with the Neighborhood Finance Corporation. These loans are not captured in the institution’s HMDA data.
CSB participated in 7 loans in 2019 (the first year of CSB’s involvement) and 18 loans in 2020. Please see the following table.
|
Geographic Distribution of Home Mortgage Loans |
||||||
|
Assessment Area: Cedar Rapids Metro |
||||||
|
Tract Income Level |
% of Owner- Occupied Housing Units |
Aggregate Performance % of # |
# |
% |
$(000s) |
% |
|
Low |
0.9 |
1.2 |
0 |
0.0 |
0 |
0.0 |
|
Moderate |
17.6 |
15.4 |
14 |
19.4 |
1,186 |
12.0 |
|
Middle |
61.5 |
58.8 |
36 |
50.0 |
4,598 |
46.5 |
|
Upper |
19.8 |
24.4 |
22 |
30.6 |
4,109 |
41.5 |
|
Total |
100.0 |
100.0 |
72 |
100.0 |
9,893 |
100.0 |
|
Source: 2015 ACS; Bank Data; 2019 HMDA Aggregate Data, Due to rounding, totals may not equal 100.0% |
||||||
Borrower Profile
The distribution of borrowers reflects reasonable penetration among businesses of different revenue sizes and individuals of varying incomes. The institution’s reasonable performance in each loan category supports this conclusion.
Small Business Lending
The distribution of small business loans among commercial operations of different sizes reflects reasonable penetration. As shown in the following table, the bank’s percentage of sampled loans to small businesses with gross annual revenues of $1 million or less is lower than D&B data, but reasonable when considering competition. As previously noted, 26 institutions operate from 72 locations in this assessment area. In addition, 2019 CRA aggregate data shows 64 lenders reported 3,301 small business loans in the assessment area; only 48.2 percent of those borrowers reported revenues of $1 million or less. Management stated that competition from entities inside and outside the assessment area is a factor. Furthermore, four of the six sampled loans to entities of over $1 million were to long-time customers who have grown into that revenue category over time. Overall, the bank’s small business lending performance reflects a reasonable distribution of loans to operations of varying revenue levels, including those with gross annual revenues of $1 million or less. Please see the following table.
|
Distribution of Small Business Loans by Gross Annual Revenue Category |
|||||
|
Assessment Area: Cedar Rapids Metro |
|||||
|
Gross Revenue Level |
% of Businesses |
# |
% |
$(000s) |
% |
|
<=$1,000,000 |
84.4 |
22 |
71.0 |
3,257 |
86.4 |
|
>$1,000,000 |
5.4 |
6 |
19.4 |
346 |
9.2 |
|
Revenue Not Available |
10.3 |
3 |
9.7 |
166 |
4.4 |
|
Total |
100.0 |
31 |
100.0 |
3,769 |
100.0 |
|
Source: 2020 D&B Data; Bank Data. Due to rounding, totals may not equal 100.0% |
|||||
Home Mortgage Lending
Overall, the distribution of home mortgage borrowers reflects reasonable penetration among individuals of differing income levels. As shown in the following table, the institution’s performance in lending to low-income borrowers in 2019 is well below that of aggregate lending data. Further review showed that lending to low-income borrowers was excellent in 2018, doubling the aggregate performance percentage. This was due, in part, to a new lender joining the institution and bringing some of their existing clientele with them; however, the effect was not sustained beyond 2018.
Lending to low-income borrowers in 2020 showed improvement from 2019, though the percentage of loans was still well below the percentage of low-income families in the assessment area. As noted in the demographic table, 6.3 percent of the assessment area’s population is below the poverty level.
These individuals would most likely have difficulty making a down payment or meeting underwriting criteria to purchase a home. Even when factoring in the percentage of individuals below the poverty line, the institution’s lending to this category of applicant is still low. The institution’s lending to low- income applicants in this assessment area is poor. Home mortgage lending to moderate-income borrowers was less than aggregate data in 2019, but still considered reasonable. Lending in 2018 was similar. Home mortgage lending was only slightly lower that the percentage of moderate-income families in the assessment area for all three years reviewed.
Examiners considered other factors when evaluating CSB’s home mortgage performance. HMDA aggregate lending data for 2019 shows that competition for mortgage lending in the assessment area is very robust, with 247 financial institutions originating 16,109 loans in the assessment area. CSB’s market share of home mortgage loans in the assessment area is 0.56 percent of the total market.
Management has stated that the institution’s business focus in this assessment area is primarily commercial in nature, not home mortgage lending. Lastly, CSB has access to offerings that are tailored to assist low-to moderate-income applicants with first-time homebuyer, renovation, and down payment programs that are not recorded on the institution’s HMDA Loan Application Register; therefore, are not factored into the analysis below. Given these factors, CSB’s home mortgage lending performance in this assessment area is reasonable overall.
|
Distribution of Home Mortgage Loans by Borrower Income Level |
||||||
|
Assessment Area: Cedar Rapids Metro |
||||||
|
Borrower Income Level |
% of Families |
Aggregate Performance % of # |
# |
% |
$(000s) |
% |
|
Low |
18.6 |
12.9 |
2 |
2.8 |
200 |
2.0 |
|
Moderate |
17.7 |
22.5 |
12 |
16.7 |
1,215 |
12.3 |
|
Middle |
23.8 |
22.3 |
22 |
30.6 |
2,723 |
27.5 |
|
Upper |
39.9 |
25.7 |
24 |
33.3 |
3,820 |
38.6 |
|
Not Available |
0.0 |
16.7 |
12 |
16.7 |
1,936 |
19.6 |
|
Totals |
100.0 |
100.0 |
72 |
100.0 |
9,893 |
100.0 |
|
Source: 2015 ACS; Bank Data; 2019 HMDA Aggregate Data. Due to rounding, totals may not equal 100.0% |
||||||
COMMUNITY DEVELOPMENT TEST
CSB’s performance regarding community development demonstrates adequate responsiveness to the needs of this assessment area, primarily due to community development lending in the form of PPP loans. Examiners considered the institution’s capacity, as well as the need and availability of such community development opportunities.
Community Development Loans
The bank originated 408 community development loans totaling approximately $14.5 million in this assessment area. Excluding the 407 PPP loans totaling approximately $14.4 million, the bank originated one community development loan totaling $30,000. The level of community development lending decreased significantly when compared to the previous evaluation, which included 19 loans totaling approximately $1.3 million. The one non-PPP qualified loan was for a small business expansion that retained employment for low- to moderate-income individuals.
Overall, the institution saw a significant increase in community development lending that aided the assessment area through SBA PPP activity.
Qualified Investments
CSB made 9 qualifying donations totaling approximately $8,000 in the Cedar Rapids Metro Assessment Area. This is an increase in number, but a decrease in dollar volume, from the prior evaluation, when the institution made 8 qualifying donations totaling approximately $16,000. There were no other investments made in this assessment area. Qualifying donations were made to promote community service, economic development, and to revitalize and stabilize certain geographies within the assessment area.
Community Development Services
The bank received consideration for two community development services that consisted of bank employees providing financial expertise to community service-related organizations within the Cedar Rapids Metro Assessment Area. This performance is an increase from the prior evaluation when no community development services were provided. One example of a responsive service is an employee providing financial and business expertise to an organization that provides accessibility ramps and stairways for qualifying low- and moderate-income individuals. This
organization also provides referral services to other organizations that may be able to help qualifying individuals with funding for other services.
DUBUQUE METRO ASSESSMENT AREA – Full-Scope Review
DESCRIPTION OF INSTITUTION’S OPERATIONS IN THE DUBUQUE METRO ASSESSMENT AREA
The Dubuque Metro Assessment Area consists of census tracts 102.01, 102.02, 104, and 105, which are located in the western half of Dubuque County, Iowa. This assessment area is part of the Dubuque, Iowa, MSA. CSB operates from one office in this assessment area, located in Dyersville, Iowa.
Economic and Demographic Data
According to 2015 ACS Census data, the assessment are consists of 4 census tracts, which includes 3 middle- and 1 upper-income census tracts. The following table illustrates the selected demographic characteristics of the Dubuque Metro Assessment Area.
|
Demographic Information of the Assessment Area Assessment Area: Dubuque Metro |
||||||
|
Demographic Characteristics |
# |
Low % of # |
Moderate % of # |
Middle % of # |
Upper % of # |
NA* % of # |
|
Geographies (Census Tracts) |
4 |
0.0 |
0.0 |
75.0 |
25.0 |
0.0 |
|
Population by Geography |
18,730 |
0.0 |
0.0 |
69.6 |
30.4 |
0.0 |
|
Housing Units by Geography |
7,189 |
0.0 |
0.0 |
71.8 |
28.2 |
0.0 |
|
Owner-Occupied Units by Geography |
5,868 |
0.0 |
0.0 |
70.6 |
29.4 |
0.0 |
|
Occupied Rental Units by Geography |
1,083 |
0.0 |
0.0 |
78.4 |
21.6 |
0.0 |
|
Vacant Units by Geography |
238 |
0.0 |
0.0 |
71.8 |
28.2 |
0.0 |
|
Businesses by Geography |
1,621 |
0.0 |
0.0 |
69.5 |
30.5 |
0.0 |
|
Farms by Geography |
218 |
0.0 |
0.0 |
79.8 |
20.2 |
0.0 |
|
Family Distribution by Income Level |
5,240 |
12.3 |
15.9 |
25.2 |
46.7 |
0.0 |
|
Household Distribution by Income Level |
6,951 |
15.8 |
14.7 |
17.6 |
51.9 |
0.0 |
|
Median Family Income MSA - 20220 Dubuque, IA MSA |
$68,157 |
Median Housing Value |
$174,229 |
|||
|
|
Median Gross Rent |
$610 |
||||
|
Families Below Poverty Level |
4.3% |
|||||
|
Source: 2015 ACS; 2020 D&B Data Due to rounding, totals may not equal 100.0% (*) The NA category consists of geographies that have not been assigned an income classification. |
||||||
According to D&B Data, there are 218 agricultural operations and 1,621 businesses in the assessment area. Service industries represent the largest portion of businesses (by number) at 27.3
percent; followed by non-classifiable establishments at 17.3 percent; and agriculture, forestry, and fishing at 11.9 percent. Additionally, 66.4 percent of businesses in the assessment area have four or fewer employees, and 92.2 percent operate from a single location. Management has stated an emphasis on agricultural lending in this assessment area, though commercial opportunities also exist due to the proximity of the City of Dubuque and its outlying areas. The effects of the recent pandemic on agricultural and business entities in this assessment area are the same as those enumerated in the Non-Metro Assessment Area analysis since the two assessment areas share a common border between Delaware and Dubuque counties and are very similar in economic and demographic attributes.
The FFIEC estimated median family income levels are used to analyze home mortgage loans under the Borrower Profile criterion and to analyze certain community development activities related to housing. The low-, moderate-, middle, and upper-income categories for the Dubuque Metro Assessment Area are detailed in the table below.
|
Median Family Income Ranges |
||||
|
Median Family Incomes |
Low <50% |
Moderate 50% to <80% |
Middle 80% to <120% |
Upper ≥120% |
|
Dubuque, IA Metro Median Family Income (20220) |
||||
|
2018 ($75,100) |
<$37,550 |
$37,550 to <$60,080 |
$60,080 to <$90,120 |
≥$90,120 |
|
2019 ($84,100) |
<$42,050 |
$42,050 to <$67,280 |
$67,280 to <$100,920 |
≥$100,920 |
|
2020 ($82,900) |
<$41,450 |
$41,450 to <$66,320 |
$66,320 to <$99,480 |
≥$99,480 |
|
Source: FFIEC |
||||
Competition
The Dubuque Metro Assessment Area is very competitive with regard to the market for financial services. The FDIC Deposit Market Share Report of June 30, 2020, indicates that there are 8 institutions operating from 37 locations in or near the assessment area. These institutions range in size from small community banks to larger financial institutions with branch locations in the assessment area. CSB ranks 8th, with 0.4 percent market share.
Credit and Community Development Needs and Opportunities
Considering information from bank management and demographic and economic data, examiners determined that small farm, small business, and home mortgage loans are primary credit needs of the assessment area. Call Reports filed by area financial institutions also support this assertion.
Further, opportunities for community development exist in the area.
CONCLUSIONS ON PERFORMANCE CRITERIA IN THE DUBUQUE METRO ASSESSMENT AREA
LENDING TEST
The institution demonstrated reasonable performance under the Lending Test in the Dubuque Metro Assessment Area, overall, as supported by Borrower Profile performance.
Geographic Distribution
The Dubuque Metro Assessment Area does not contain any low- or moderate-income geographies; therefore, examiners did not evaluate the geographic distribution of loans, as a review would not have resulted in meaningful conclusions.
Borrower Profile
The distribution of borrowers reflects reasonable penetration among farms and businesses of differing revenue sizes, and individuals of differing income levels. The institution’s reasonable performance in the small farm and small business categories, as well as excellent performance in the home mortgage category, supports this conclusion.
Small Farm Lending
The distribution of borrowers reflects reasonable penetration among farms of different sizes. The lending to farms with gross annual revenues of $1 million or less is slightly below, but still comparable to, D&B data.
|
Distribution of Small Farm Loans by Gross Annual Revenue Category |
|||||
|
Assessment Area: Dubuque Metro |
|||||
|
Gross Revenue Level |
% of Farms |
# |
% |
$(000s) |
% |
|
<=$1,000,000 |
98.2 |
23 |
88.5 |
3,551 |
86.8 |
|
>$1,000,000 |
0.9 |
2 |
7.7 |
531 |
13.0 |
|
Revenue Not Available |
0.9 |
1 |
3.8 |
9 |
0.2 |
|
Total |
100.0 |
26 |
100.0 |
4,091 |
100.0 |
|
Source: 2020 D&B Data; Bank Data. Due to rounding, totals may not equal 100.0% |
|||||
Small Business Lending
The distribution of small business loans among commercial operations of different sizes reflects reasonable penetration. Initial review results show that the institution’s level of lending is below that of D&B benchmark data; however, further review showed an anomaly in the random sample.
Specifically, of the eight loans sampled that are in the category of small business loans to entities with gross annual revenues of over $1 million, six of them were made to two entities, thus inflating the percentage in that category. Management indicated that one customer that had two loans in this category was originally smaller than $1 million gross annual revenues when they started with the bank and grew larger over time. In addition, aggregate CRA data collected from other reporting institutions shows a high level of competition for commercial lending in Dubuque County, indicating that only
- percent of commercial loans reported for 2020 was to entities with gross annual revenues under
$1 million. Considering these factors, CSB’s lending to small business entities in this assessment area is reasonable.
|
Distribution of Small Business Loans by Gross Annual Revenue Category |
|||||
|
Assessment Area: Dubuque Metro |
|||||
|
Gross Revenue Level |
% of Businesses |
# |
% |
$(000s) |
% |
|
<=$1,000,000 |
85.5 |
16 |
64.0 |
2,563 |
71.7 |
|
>$1,000,000 |
5.7 |
8 |
32.0 |
987 |
27.6 |
|
Revenue Not Available |
8.8 |
1 |
4.0 |
27 |
0.8 |
|
Total |
100.0 |
25 |
100.0 |
3,577 |
100.0 |
|
Source: 2020 D&B Data; Bank Data. Due to rounding, totals may not equal 100.0% |
|||||
Home Mortgage Lending
The distribution of home mortgage borrowers reflects excellent penetration among individuals of different income levels. As shown in the table below, the institution’s performance in home mortgage lending to low-income borrowers is well above aggregate data in 2019. Home mortgage lending to moderate-income borrowers was slightly above aggregate data in 2019. Overall, the institution’s home mortgage lending throughout the period reviewed for this assessment area is excellent.
|
Distribution of Home Mortgage Loans by Borrower Income Level |
||||||
|
Assessment Area: Dubuque Metro |
||||||
|
Borrower Income Level |
% of Families |
Aggregate Performance % of # |
# |
% |
$(000s) |
% |
|
Low |
12.3 |
11.4 |
7 |
38.9 |
665 |
33.7 |
|
Moderate |
15.9 |
18.1 |
4 |
22.2 |
437 |
22.1 |
|
Middle |
25.2 |
23.8 |
3 |
16.7 |
276 |
14.0 |
|
Upper |
46.7 |
37.5 |
4 |
22.2 |
597 |
30.2 |
|
Not Available |
0.0 |
9.2 |
0 |
0.0 |
0 |
0.0 |
|
Total |
100.0 |
100.0 |
18 |
100.0 |
1,975 |
100.0 |
|
Source: 2015 ACS; Bank Data; 2019 HMDA Aggregate Data. Due to rounding, totals may not equal 100.0% |
||||||
COMMUNITY DEVELOPMENT TEST
CSB’s performance regarding community development demonstrates adequate responsiveness to the needs of this assessment area, primarily due to community development lending in the form of PPP loans and the provision of community development services. Examiners considered the institution’s capacity, as well as the need and availability of such community development opportunities.
Community Development Loans
The bank originated 165 community development loans totaling approximately $3.2 million in this assessment area; all of this activity was in the form of PPP lending. The bank did not originate any community development loans outside of the PPP, which is consistent with their performance in this
assessment area at the previous evaluation. The PPP is responsive to the assessment area’s economic development needs that arose out of the pandemic by providing funds to help businesses retain employees, including low- to moderate-income individuals. Therefore, the institution saw a significant increase in community development lending that aided the assessment area.
Qualified Investments
There were no qualified investments or donations made in this assessment area during the evaluation period, which is consistent with the bank’s performance at the previous evaluation for this assessment area.
Community Development Services
The bank received consideration for a total of eight community development services that primarily consisted of bank employees providing financial expertise to community service-related organizations within the Dubuque Metro Assessment Area. The number of community development services increased from the prior evaluation when no community development services were provided. All services provided in this assessment area were related to using employee’s expertise to help organizations concerned with economic and business development.
These services help to retain and bring new businesses into the area that would create jobs for local residents.
APPENDICES
INTERMEDIATE SMALL BANK PERFORMANCE CRITERIA
Lending Test
The Lending Test evaluates the bank’s record of helping to meet the credit needs of its assessment area(s) by considering the following criteria:
- The bank’s loan-to-deposit ratio, adjusted for seasonal variation, and, as appropriate, other lending-related activities, such as loan originations for sale to the secondary markets, community development loans, or qualified investments;
- The percentage of loans, and as appropriate, other lending-related activities located in the bank’s assessment area(s);
- The geographic distribution of the bank’s loans;
- The bank’s record of lending to and, as appropriate, engaging in other lending-related activities for borrowers of different income levels and businesses and farms of different sizes; and
- The bank’s record of taking action, if warranted, in response to written complaints about its performance in helping to meet credit needs in its assessment area(s).
Community Development Test
The Community Development Test considers the following criteria:
- The number and amount of community development loans;
- The number and amount of qualified investments;
- The extent to which the bank provides community development services; and
- The bank’s responsiveness through such activities to community development lending, investment, and service
GLOSSARY
Aggregate Lending: The number of loans originated and purchased by all reporting lenders in specified income categories as a percentage of the aggregate number of loans originated and purchased by all reporting lenders in the metropolitan area/assessment area.
American Community Survey (ACS): A nationwide United States Census survey that produces demographic, social, housing, and economic estimates in the form of five year estimates based on population thresholds.
Area Median Income: The median family income for the MSA, if a person or geography is located in an MSA; or the statewide nonmetropolitan median family income, if a person or geography is located outside an MSA.
Assessment Area: A geographic area delineated by the bank under the requirements of the Community Reinvestment Act.
Census Tract: A small, relatively permanent statistical subdivision of a county or equivalent entity. The primary purpose of census tracts is to provide a stable set of geographic units for the presentation of statistical data. Census tracts generally have a population size between 1,200 and 8,000 people, with an optimum size of 4,000 people. Census tract boundaries generally follow visible and identifiable features, but they may follow nonvisible legal boundaries in some instances. State and county boundaries always are census tract boundaries.
Combined Statistical Area (CSA): A combination of several adjacent metropolitan statistical areas or micropolitan statistical areas or a mix of the two, which are linked by economic ties.
Community Development: For loans, investments, and services to qualify as community development activities, their primary purpose must:
- Support affordable housing for low- and moderate-income individuals;
- Target community services toward low- and moderate-income individuals;
- Promote economic development by financing small businesses or farms; or
- Provide activities that revitalize or stabilize low- and moderate-income geographies, designated disaster areas, or distressed or underserved nonmetropolitan middle-income
Community Development Corporation (CDC): A CDC allows banks and holding companies to make equity type of investments in community development projects. Institution CDCs can develop innovative debt instruments or provide near-equity investments tailored to the development needs of the community. Institution CDCs are also tailored to their financial and marketing needs. A CDC may purchase, own, rehabilitate, construct, manage, and sell real property. Also, it may make equity or debt investments in development projects and in local businesses. The CDC activities are expected to directly benefit low- and moderate-income groups, and the investment dollars should not represent an undue risk on the banking organization.
Community Development Financial Institutions (CDFIs): CDFIs are private intermediaries (either for profit or nonprofit) with community development as their primary mission. A CDFI facilitates the flow of lending and investment capital into distressed communities and to individuals who have been unable to take advantage of the services offered by traditional financial institutions. Some basic types of CDFIs include community development banks, community development loan funds, community development credit unions, micro enterprise funds, and community development venture capital funds.
A certified CDFI must meet eligibility requirements. These requirements include the following:
- Having a primary mission of promoting community development;
- Serving an investment area or target population;
- Providing development services;
- Maintaining accountability to residents of its investment area or targeted population through representation on its governing board of directors, or by other means;
- Not constituting an agency or instrumentality of the United States, of any state or political subdivision of a state.
Community Development Loan: A loan that:
- Has as its primary purpose community development; and
- Except in the case of a wholesale or limited purpose institution:
- Has not been reported or collected by the institution or an affiliate for consideration in the institution’s assessment area as a home mortgage, small business, small farm, or consumer loan, unless it is a multifamily dwelling loan (as described in Appendix A to Part 203 of this title); and
- Benefits the institution’s assessment area(s) or a broader statewide or regional area including the institution’s assessment area(s).
Community Development Service: A service that:
- Has as its primary purpose community development;
- Is related to the provision of financial services; and
- Has not been considered in the evaluation of the institution’s retail banking services under § 24(d).
Consumer Loan(s): A loan(s) to one or more individuals for household, family, or other personal expenditures. A consumer loan does not include a home mortgage, small business, or small farm loan. This definition includes the following categories: motor vehicle loans, credit card loans, home equity loans, other secured consumer loans, and other unsecured consumer loans.
Core Based Statistical Area (CBSA): The county or counties or equivalent entities associated with at least one core (urbanized area or urban cluster) of at least 10,000 population, plus adjacent counties having a high degree of social and economic integration with the core as measured through commuting ties with the counties associated with the core. Metropolitan and Micropolitan Statistical Areas are the two categories of CBSAs.
Distressed Middle-Income Nonmetropolitan Geographies: A nonmetropolitan middle-income geography will be designated as distressed if it is in a county that meets one or more of the following triggers:
- An unemployment rate of at least 5 times the national average;
- A poverty rate of 20 percent or more; or
- A population loss of 10 percent or more between the previous and most recent decennial census or a net migration loss of 5 percent or more over the 5-year period preceding the most recent
Family: Includes a householder and one or more other persons living in the same household who are related to the householder by birth, marriage, or adoption. The number of family households always equals the number of families; however, a family household may also include non-relatives living with the family. Families are classified by type as either a married-couple family or other family. Other family is further classified into “male householder” (a family with a male householder and no wife present) or “female householder” (a family with a female householder and no husband present).
FFIEC-Estimated Income Data: The Federal Financial Institutions Examination Council (FFIEC) issues annual estimates which update median family income from the metropolitan and nonmetropolitan areas. The FFIEC uses American Community Survey data and factors in information from other sources to arrive at an annual estimate that more closely reflects current economic conditions.
Full-Scope Review: A full-scope review is accomplished when examiners complete all applicable interagency examination procedures for an assessment area. Performance under applicable tests is analyzed considering performance context, quantitative factors (e.g, geographic distribution, borrower profile, and total number and dollar amount of investments), and qualitative factors (e.g, innovativeness, complexity, and responsiveness).
Geography: A census tract delineated by the United States Bureau of the Census in the most recent decennial census.
Home Mortgage Disclosure Act (HMDA): The statute that requires certain mortgage lenders that do business or have banking offices in a metropolitan statistical area to file annual summary reports of their mortgage lending activity. The reports include such data as the race, gender, and the income of applicants; the amount of loan requested; and the disposition of the application (approved, denied, and withdrawn).
Home Mortgage Loans: Includes closed-end mortgage loans or open-end line of credits as defined in the HMDA regulation that are not an excluded transaction per the HMDA regulation.
Housing Unit: Includes a house, an apartment, a mobile home, a group of rooms, or a single room that is occupied as separate living quarters.
Limited-Scope Review: A limited scope review is accomplished when examiners do not complete all applicable interagency examination procedures for an assessment area.
Performance under applicable tests is often analyzed using only quantitative factors (e.g, geographic distribution, borrower profile, total number and dollar amount of investments, and branch distribution).
Low-Income: Individual income that is less than 50 percent of the area median income, or a median family income that is less than 50 percent in the case of a geography.
Low Income Housing Tax Credit: The Low-Income Housing Tax Credit Program is a housing program contained within the Internal Revenue Code of 1986, as amended. It is administered by the U.S. Department of the Treasury and the Internal Revenue Service. The U.S. Treasury Department distributes low-income housing tax credits to housing credit agencies through the Internal Revenue Service. The housing agencies allocate tax credits on a competitive basis.
Developers who acquire, rehabilitate, or construct low-income rental housing may keep their tax credits. Or, they may sell them to corporations or investor groups, who, as owners of these properties, will be able to reduce their own federal tax payments. The credit can be claimed annually for ten consecutive years. For a project to be eligible, the developer must set aside a specific percentage of units for occupancy by low-income residents. The set-aside requirement remains throughout the compliance period, usually 30 years.
Market Share: The number of loans originated and purchased by the institution as a percentage of the aggregate number of loans originated and purchased by all reporting lenders in the metropolitan area/assessment area.
Median Income: The median income divides the income distribution into two equal parts, one having incomes above the median and other having incomes below the median.
Metropolitan Division (MD): A county or group of counties within a CBSA that contain(s) an urbanized area with a population of at least 2.5 million. A MD is one or more main/secondary counties representing an employment center or centers, plus adjacent counties associated with the main/secondary county or counties through commuting ties.
Metropolitan Statistical Area (MSA): CBSA associated with at least one urbanized area having a population of at least 50,000. The MSA comprises the central county or counties or equivalent entities containing the core, plus adjacent outlying counties having a high degree of social and economic integration with the central county or counties as measured through commuting.
Middle-Income: Individual income that is at least 80 percent and less than 120 percent of the area median income, or a median family income that is at least 80 and less than 120 percent in the case of a geography.
Moderate-Income: Individual income that is at least 50 percent and less than 80 percent of the area median income, or a median family income that is at least 50 and less than 80 percent in the case of a geography.
Multi-family: Refers to a residential structure that contains five or more units.
Nonmetropolitan Area (also known as non-MSA): All areas outside of metropolitan areas. The definition of nonmetropolitan area is not consistent with the definition of rural areas. Urban and rural classifications cut across the other hierarchies. For example, there is generally urban and rural territory within metropolitan and nonmetropolitan areas.
Owner-Occupied Units: Includes units occupied by the owner or co-owner, even if the unit has not been fully paid for or is mortgaged.
Qualified Investment: A lawful investment, deposit, membership share, or grant that has as its primary purpose community development.
Rated Area: A rated area is a state or multistate metropolitan area. For an institution with domestic branches in only one state, the institution’s CRA rating would be the state rating. If an institution maintains domestic branches in more than one state, the institution will receive a rating for each state in which those branches are located. If an institution maintains domestic branches in two or more states within a multistate metropolitan area, the institution will receive a rating for the multistate metropolitan area.
Rural Area: Territories, populations, and housing units that are not classified as urban.
Small Business Investment Company (SBIC): SBICs are privately-owned investment companies which are licensed and regulated by the Small Business Administration (SBA). SBICs provide long-term loans and/or venture capital to small firms. Because money for venture or risk investments is difficult for small firms to obtain, SBA provides assistance to SBICs to stimulate and supplement the flow of private equity and long-term loan funds to small companies. Venture capitalists participate in the SBIC program to supplement their own private capital with funds borrowed at favorable rates through SBA’s guarantee of SBIC debentures. These SBIC debentures are then sold to private investors. An SBIC’s success is linked to the growth and profitability of the companies that it finances. Therefore, some SBICs primarily assist businesses with significant growth potential, such as new firms in innovative industries. SBICs finance small firms by providing straight loans and/or equity-type investments. This kind of financing gives them partial ownership of those businesses and the possibility of sharing in the companies’ profits as they grow and prosper.
Small Business Loan: A loan included in “loans to small businesses” as defined in the Consolidated Report of Condition and Income (Call Report). These loans have original amounts of
$1 million or less and are either secured by nonfarm nonresidential properties or are classified as commercial and industrial loans.
Small Farm Loan: A loan included in “loans to small farms” as defined in the instructions for preparation of the Consolidated Report of Condition and Income (Call Report). These loans have original amounts of $500,000 or less and are either secured by farmland, including farm residential and other improvements, or are classified as loans to finance agricultural production and other loans to farmers.
Underserved Middle-Income Nonmetropolitan Geographies: A nonmetropolitan middle- income geography will be designated as underserved if it meets criteria for population size, density, and dispersion indicating the area’s population is sufficiently small, thin, and distant from a population center that the tract is likely to have difficulty financing the fixed costs of meeting essential community needs.
Upper-Income: Individual income that is 120 percent or more of the area median income, or a median family income that is 120 percent or more in the case of a geography.
Urban Area: All territories, populations, and housing units in urbanized areas and in places of 2,500 or more persons outside urbanized areas. More specifically, “urban” consists of territory, persons, and housing units in places of 2,500 or more persons incorporated as cities, villages, boroughs (except in Alaska and New York), and towns (except in the New England states, New York, and Wisconsin).
“Urban” excludes the rural portions of “extended cities”; census designated place of 2,500 or more persons; and other territory, incorporated or unincorporated, including in urbanized areas.